Abstract
Calculation of 31P NMR chemical shifts for a series of tri- and tetracoordinate phosphorus compounds using several basis sets and density functional theory (DFT) functionals gave a modest fit to experimental chemical shifts, but an excellent linear fit when plotted against the experimental values. The resultant scaling methods were then applied to a variety of “large” compounds previously selected by Latypov et al. and a set of stereoisomeric and unusual compounds selected here. No one method was best for all structural types. For compounds that contain P–P bonds and P–C multiple bonds, the Latypov et al. method using the PBE0 functional was best (mean absolute deviation/root mean square deviation (MAD/RMSD) = 6.9/8.5 ppm and 6.6/8.2 ppm, respectively), but for the full set of compounds gave higher deviations (MAD/RMSD = 8.2/12.3 ppm), and failed by over 60 ppm for a three-membered phosphorus heterocycle. Use of the M06-2X functional for both the structural optimization and NMR chemical shift calculation was best overall for the compounds without P–C multiple bonds (MAD/RMSD = 5.4/7.1 ppm), but failed by 30–49 ppm for compounds having any P–C multiple-bond character. Failures of these magnitudes have not been reported previously for these widely used functionals. These failures were then used to screen a variety of recommended functionals, leading to better overall methods for calculation of these chemical shifts: optimization with the M06-2X functional and NMR calculation with the PBE0 or ωB97x-D functionals gave values for MAD/RMSD = 6.9/8.5 ppm and 6.8/9.1 ppm, respectively, over an experimental chemical shift range of −181 to 356 ppm. Due to the unexplained failures observed, we recommend use of more than one method when looking at novel structures.

Graphical Abstract
Introduction
Calculation of 1H and 13C NMR chemical shifts and coupling constants using density functional theory (DFT) has increasingly become an adjunct to structure determination [1-8]. In particular for complex organic compounds, determination of relative stereochemistry using such calculations is a powerful technique [9-13]. A set of recommendations for best practices has been proposed [1-3,14] and made available online [15] describing basis set choices, geometry optimization, incorporation of solvation, and use of scaling factors derived from linear regressions between computed and experimental chemical shifts. In contrast, reports of calculation of 31P NMR chemical shifts – which span a range of roughly 500 ppm – have, even recently, used empirical methods [16], and theoretical methods have focused more on the choice of basis set to better match experimental chemical shifts of relatively small molecules [17-24]. For instance, while calculations for 1H NMR are considered to be sufficiently reliable using DFT methods with the 6-311+G(2d,p) basis set [15], work on 31P NMR chemical shifts has favored [18,21,24] the use of larger basis sets such as the IGLO-III [25,26] and pcS-n [27,28] basis sets with a focus on improved calculation of NMR shielding constants. Some theoretical work has been carried out on specialized phosphorus compounds that cover only a small range of chemical shifts, including nucleic acids [29-32] and polyoxometalates [33]. More recently, DFT methods have been applied to transition metal phosphorus complexes that cover a wide range of chemical shifts [34,35] using methods related to what we will describe here, but such studies are beyond the scope of this paper and typically focus on one metal at a time.
In the same way that improved results are obtainable for both 1H and 13C NMR chemical shifts using scaling methods, calculation of 31P NMR chemical shifts benefit as well from scaling. Chesnut first showed that scaling of the paramagnetic term of chemical shieldings calculated using the B3LYP functional and the 6-311+G(2d,p) basis set gave improved fits to experimental results, and further noted that while scaling is empirical, DFT methods themselves have an empirical component [36]. More recent studies have included a variety of functionals and basis sets in order to determine if there is a best combination in terms of accuracy and speed [22,23,37]. Even within the specialized studies of specific types of phosphorus compounds, scaling was found to give significant improvement [33]. A number of reports have speculated that scaling is needed to correct for rovibrational effects [21,24,36], and recent reports show that molecular dynamics methods can eliminate the need for empirical corrections [29,30,38]. However, these calculation-intensive methods are not likely to become routine soon, potentially leaving room for empirical scaling to be useful for some time.
The calculation-intensive and scaling approaches recently have been characterized by Jensen as the “purist” and “application” approaches [8], and the leading work on calculations of 31P NMR chemical shifts reflect one of each, namely, the “purist” approach reported by Krivdin [24] and the “application” approach due to Latypov [37]. The Krivdin group reported a group of 53 phosphorus compounds, which were first optimized at the MP2/6-311G(d,p) level with IEF-PCM solvation; 31P NMR chemical shifts were then calculated using the DFT KT2 functional [39] and a dual pcS-3/pcS-2 basis set [27,28]. In this case the use of the locally dense basis set approach, in which the larger pcS-3 basis set was used on phosphorus and the smaller pcS-2 basis set was then used on all the other atoms, allowed the computation of chemical shifts for a variety of benchmark compounds up to 35-atom triphenylphosphine oxide. Comparison of the calculated chemical shifts with the experimental values gave a mean absolute deviation and root mean square deviation (MAD/RMSD) [3,40] of 9.4/12.0 ppm over a roughly 550 ppm range. The Latypov group reported a training set of 22 phosphorus compounds, which were first optimized at a significantly lower but more easily implemented level of theory (PBE0 functional [41], 6-31+G(d) basis set, gas phase), followed by calculation of the 31P NMR chemical shifts with the same PBE0 functional with the still-modest 6-311G(2d,2p) basis set. While the calculated fit to experimental values was significantly worse than the higher-level Krivdin method (MAD/RMSD = 18.7/21.9 ppm), the linear fit of the calculated chemical shifts of the 22 training set compounds to their experimental values gave a scaled set of corrected calculated values with a much-improved MAD/RMSD = 9.3/10.9 ppm over a roughly 500 ppm range. That is, scaling of the theoretical results to experimental values gave values with deviations comparable to the unscaled results obtained at much higher levels of theory. In addition, the Latypov results provide a prescription that could be applied readily to larger and more interesting novel compounds. A collection of 10 such compounds actually gave a somewhat better scaled MAD/RMSD of 6.9/9.0 ppm, using the scaling factors derived from the benchmark set of 22 compounds.
In addition to the above review of 31P chemical shift calculations, a recent review by Krivdin covered an additional range of factors for higher-level calculations, scaling, and a variety of specialized compounds [42]. In this paper we describe work that had been in progress when the Latypov group’s report was published. It is similar in style, in that we describe the use of significantly lower levels of DFT calculations than the Krivdin group, but the motivation was to develop a high-accuracy method that would allow identification of both unusual phosphorus compounds and of stereochemistry, and still be accessible to organic chemists without specialized software. In addition, we were concerned by some of the choices made by the Latypov group for their training set of compounds, and so sought to use a much simpler set of phosphorus compounds for scaling purposes. We report here (1) a comparison of basis sets for calculation of a range of 31P NMR chemical shifts of well-known tri- and tetracoordinate phosphorus compounds, (2) development of scaling factors for calculation of 31P NMR chemical shifts, and (3) application of this method to determination of stereochemistry at phosphorus in heterocycles and to corroboration of some unusual compounds that have been reported previously. At that point we were left with two or possibly three structural types for which some of these methods failed to provide accurate chemical shifts, and so we report here (4) a search of 23 more recent combinations of DFT functionals that have been recommended for theoretical reasons, expedited by focusing on these failures.
Results and Discussion
1. Experimental chemical shifts. A number of compilations of 31P NMR chemical shifts were published early in the development of NMR [43-45], followed by book-length compilations [46-48]. These chemical shifts were referenced to external 85% H3PO4 at 0 ppm (with positive values reported here downfield of H3PO4). The early work of necessity included mostly pure liquid samples, that is, without any deuterated solvents, and one of the compilations noted that chemical shift changes upon dilution with CS2, CCl4, CHCl3, and ethanol were all small (<2 ppm) [43]. As much as possible, we have tried to use chemical shifts in CDCl3 solution, and for the cases where we have literature data or have measured the chemical shifts ourselves, have found the solution values are very close to the reported liquid values (liquid/CDCl3 in ppm: PCl3 220 [44]/219.79; P(OMe)3 141 [44]/141.41; (iPrO)2P(O)CH3 27.4 [49]/28.61; (iPrO)2P(O)H 4.2 [43]/4.54; PMe3 −62 [44]/−61.58 [50]). We have also included chemical shifts in more polar solvents (i.e., DMSO and methanol) when those were the only reported values.
The chemical shifts of two commonly used reference standards for 31P NMR calculations require comment, since a reference is needed to convert the calculated absolute magnetic shielding (σ) to the chemical shift (δ). The calculated chemical shift δ(31P)calcd is given by the difference between the absolute magnetic shielding values of the reference and the desired phosphorus compound calculated at the same level of theory, plus the experimental chemical shift of the reference compound (Equation 1) [18,21,26].
![[1860-5397-19-4-i1]](/bjoc/content/inline/1860-5397-19-4-i1.svg?max-width=590&scale=1.18182)
Since the 85% H3PO4 reference standard is a roughly 1:1 molar solution of phosphoric acid in water [51], calculation of its absolute magnetic shielding might be expected to be complicated by water solvation, as well as ionization or aggregation of the phosphoric acid in water, and calculation as a gas-phase chemical shift is also unreasonable [51]. Because of these issues, other studies have used PH3 as an alternative theoretical reference standard [18,19], despite the fact that actual use of this compound requires a fairly extraordinary experimental setup [52,53]. An additional issue with PH3 involves the choice of using the gas-phase or liquid-phase experimental chemical shifts, which differ dramatically: the universally used value for the gas-phase chemical shift is −266.1 ppm (referenced to external 85% H3PO4) [54], while the liquid-phase chemical shift is −238 ppm at −90 °C [44] and is also −238 ppm at 23 °C in CCl4 [52]. In the two 31P NMR studies described in the Introduction, Latypov used the gas-phase value [37] and Krivdin the liquid-phase value [24]. As noted above, the CDCl3 solution values are close to the liquid values, and so we will use the −238 ppm chemical shift for PH3, and would argue this value is the correct one for comparisons to other solution spectra. We would further argue that the simplest solution to the reference problem when scaling is used would be the calculation of all chemical shifts referenced to H3PO4 with water solvation since this provides values that can be compared immediately to experimental chemical shifts; further, as will be explained below, scaling eliminates the need for the calculated absolute shielding of the reference.
2. Calculation of chemical shifts. A small number of trivalent phosphorus compounds spanning a roughly 460 ppm chemical shift range was chosen initially to examine basis set effects, namely, PH3, PMeH2, PMe2H, PMe3, PPh3, P(OMe)3, methoxyphospholane (i.e., MeOP(OCH2CH2O)), and PCl3, each of which has been used in recent reports of phosphorus chemical shift calculations [18,20,21,24,37] except for the phospholane, and more surprisingly with one exception [24], PPh3 (Figure 1; see Computational and NMR Details section). For each of these, optimization (Gaussian 09 [55], DFT with 6-31+G(d,p) basis set) included solvation using the default polarizable continuum model (IEF-PCM using CHCl3), and except for trimethylphosphite resulted in one energy minimum. We found three local minima for trimethylphosphite, so NMR spectra were calculated for each and the energy-weighted average was used for the calculated chemical shift; methoxyphospholane was added as an alternative to trimethylphosphite simply because it seemed likely that it would exhibit only one local minimum, and so could provide a check on the calculated chemical shift. The choice of basis set for the optimizations was guided by recommendations by Tantillo and co-workers [3] for cases involving multiple conformations, and in addition here the presence of lone pairs on third-row atoms provides additional reason to use a higher level basis set than the usual 6-31G(d) [3]. As pointed out by van Wüllen [18], the energy-optimized structure for PCl3 is not a good fit to the experimental geometry [56], and the chemical shift changes significantly with geometry. Chemical shift values for both the optimized structure and the experimental geometry were therefore calculated, and the latter was much closer to the experimental chemical shift. For each compound, GIAO calculation of the chemical shift was carried out first using the widely used 6-311+G(2d,p) basis set with the B3LYP and PBE0 functionals, both used for 1H NMR calculations [3,15]. One lower-level basis set was used (6-311G(d,p)) [21], as well as two higher-level basis sets used by others [18,21,24] (IGLO-III [25,26] and pcS-2 [27,28]) specifically optimized for 31P, each with the B3LYP functional. Another widely used functional, M06-2X [57,58], was also used for the optimization (again using the 6-31+G(d,p) basis set) with the NMR chemical shifts calculated using both the B3LYP and M06-2X functionals with the 6-311+G(2d,p) basis set and IEF-PCM (CHCl3) solvation. Last, two versions of the Latypov method were calculated. In one, the structures were both optimized (PBE0/6-31+G(d,p), IEF-PCM using CHCl3) and the NMR calculated (PBE0/6-311+G(2d,p), IEF-PCM using CHCl3) in the same manner as the calculation methods described above. In the other, the same method as used by Latypov (PBE0 gas phase 6-31+G(d) optimization followed by PBE0 gas phase 6-311G(2d,2p) NMR) was carried out in order to allow a direct comparison [37]. Results may be found in Tables S1–S3 in Supporting Information File 1 for both the absolute chemical shifts and the chemical shifts referenced to that calculated for 85% H3PO4 at 0 ppm according to Equation 1. As described above, the same functionals and basis sets were used for H3PO4 but with water solvation, except when using the gas-phase Latypov method.
![[1860-5397-19-4-1]](/bjoc/content/figures/1860-5397-19-4-1.svg?scale=2.0&max-width=1024&background=FFFFFF)
Figure 1: Training set of tri- and tetracoordinate phosphorus compounds; chemical shifts are in ppm, referenced to external 85% H3PO4 at 0 ppm (positive values downfield of H3PO4).
Figure 1: Training set of tri- and tetracoordinate phosphorus compounds; chemical shifts are in ppm, referenc...
As expected, on the basis of the results reported by Krivdin and Latypov, the agreement between experimental and calculated chemical shifts, regardless of the basis set, for these simple compounds is poor. The MAD/RMSD values averaged 21/25 ppm and were remarkably similar for the nine combinations of DFT functionals, optimizations, and basis sets chosen. This was true both for the two larger basis sets optimized for phosphorus (IGLO-III and pcS-2) and the smaller basis set (due to the absence of diffuse orbitals) that gave significantly shortened computational times (6-311G(d,p)) [21].
A second set of tetracoordinate phosphorus compounds was then added to the trivalent set for scaling (Figure 1). In contrast to common trivalent phosphorus compounds, the chemical shifts of typical tetracoordinate analogues do not span such a large range, nor have calculations been routinely reported. A set of 13 compounds (with 14 different phosphorus atoms) was chosen, including PY4+ (Y = H, Me, Ph, OMe, OPh), Y3P=O (Y = Me, Ph), O=P(OCH2)3P=O, Y2P(O)H (Y = MeO, iOPr), Y2P(O)Me (Y = MeO, iOPr), and EtOP(O)Me2. Despite spanning a chemical shift range of only about 150 ppm, this set exhibited a wider range of structural types than the trivalent compounds. A number of the compounds required inclusion of several conformational isomers, and for the cationic compounds, the counterions were included, and the experimental chemical shifts included compounds as pure liquids and as CDCl3, CH2Cl2, CH3CN, DMSO, and CH3OH solutions (see Computational and NMR Details section). Minimizations and NMR chemical shift calculations were carried out as before, albeit all with CHCl3 solvation, and once again as expected, the average MAD/RMSD values of 9/12 ppm were high (albeit lower than the trivalent compounds) and together the MAD/RMSD values averaged 13.5/18.1 ppm.
3. Scaling of chemical shifts. Each of the sets of calculated chemical shifts was next plotted against the experimental chemical shifts according to Equation 2 to give an empirical scaling relationship [36] with a unique slope and intercept for both the training set compounds and the calculation methods used (Table S4 in Supporting Information File 1).
![[1860-5397-19-4-i2]](/bjoc/content/inline/1860-5397-19-4-i2.svg?max-width=590&scale=1.18182)
This resulted in extraordinarily linear fits for the trivalent phosphorus compounds spanning the full chemical shift range, and a bit more scatter of the tetracoordinate compounds over their smaller range. The slope and intercept were then used to convert the DFT-calculated values to the empirically more accurate scaled values according to Equation 3, allowing the scaled MAD/RMSD values to be determined (Table 1 and Table S5 (Supporting Information File 1), and Figure 2).
![[1860-5397-19-4-i3]](/bjoc/content/inline/1860-5397-19-4-i3.svg?max-width=590&scale=1.18182)
Table 1: MADa and RMSDa (ppm) for scaled 31P NMR chemical shifts.b
| Optimization functionalc | NMR functionalc | NMR basis setc | MAD/RMSD all datad |
| B3LYP | B3LYP | 6-311G(d,p) | 8.9/10.6 |
| B3LYP | B3LYP | 6-311+G(2d,p) | 7.0/8.4 |
| M06-2X | B3LYP | 6-311+G(2d,p) | 6.5/8.0 |
| M06-2X | M06-2X | 6-311+G(2d,p) | 4.1/5.7 |
| B3LYP | B3LYP | IGLO-III | 6.0/7.1 |
| B3LYP | B3LYP | pcS-2 | 6.5/8.0 |
| B3LYP | PBE0 | 6-311+G(2d,p) | 6.2/7.6 |
| PBE0 | PBE0 | 6-311+G(2d,p) | 5.9/7.1 |
| PBE0e | PBE0e | 6-311G(2d,2p)e | 7.8/9.7 |
aMAD/RMSD: mean absolute deviation (MAD = Σn|δcalc − δexp|/n) and root mean square deviation (RMSD = [Σn(δcalc − δexp)2/n]1/2) [3,40]. bIn all tables, notable results (i.e., best and among the worst) are in bold, and the very best in bold italics. cOptimization basis set/solvent and NMR solvent, except as noted: 6-31+G(d,p)/CHCl3. dDeviations calculated for the training set of tri- and tetracoordinate phosphorus compounds (Supporting Information File 1, Table S5, 22 points). eOptimization (6-31+G(d)/gas phase) and NMR (gas phase) for the same training set of tri- and tetracoordinate phosphorus compounds, but following Latypov’s method [37].
![[1860-5397-19-4-2]](/bjoc/content/figures/1860-5397-19-4-2.png?scale=2.0&max-width=1024&background=FFFFFF)
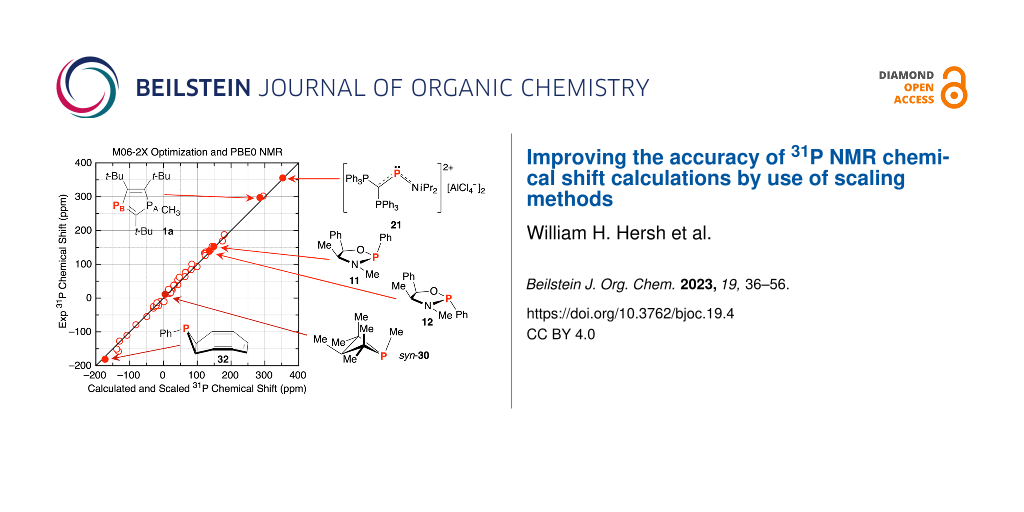
Figure 2: (a) Plot of experimental vs calculated chemical shifts of tri- and tetracoordinate phosphorus compounds (M06-2X optimization and NMR (6-311+G(2d,p) basis set) referenced to H3PO4, IEF-PCM CHCl3 solvation). Equation 2 m = 0.855 ± 0.011, b = 4.91 ± 1.27, giving scaled MAD/RMSD = 4.1/5.7 ppm (Equation 3). (b) Plot of experimental vs calculated chemical shifts of tri- and tetracoordinate phosphorus compounds (Latypov PBE0 optimization and NMR (6-311G(2d,2p) basis set) referenced to H3PO4, gas phase). Equtation 2: m = 0.858 ± 0.019, b = 12.36 ± 2.19, giving MAD/RMSD = 7.8/9.7 ppm. For both (a) and (b), see Table S3 in Supporting Information File 1; the points for PCl3 (DFT calculated geometry) and PH3 (gas phase) were not included in the linear fits.
Figure 2: (a) Plot of experimental vs calculated chemical shifts of tri- and tetracoordinate phosphorus compo...
The average MAD/RMSD values dropped from 13.5/18.1 ppm to an average of 6.0/7.4 ppm for most of the optimization/NMR combinations; the B3LYP method using a smaller basis set and the Latypov method using the phosphorus compounds described above both exhibited higher deviations. The higher deviations for the Latypov method (7.8/9.7 ppm), using gas-phase calculations and smaller basis sets with this set of phosphorus compounds, compared to our method (5.9/7.1 ppm) with CHCl3 solvation and the larger basis sets, is notable. The greater scatter is clearly visible by comparing the scaling plot for the Latypov method in Figure 2b to the best fit method using the M06-2X functional for both optimization and the NMR calculation (Figure 2a, MAD/RMSD = 4.1/5.7 ppm). For both scaling plots, the fit shown occurs using the experimental rather than the calculated geometry for PCl3, consistent with van Wüllen’s observation [18] noted above. Also consistent with our observation on the use of the liquid chemical shift value for PH3, the fit for both scaling plots shown occurs with the liquid rather than the gas chemical shift. That is, as seen in Figure 2a, the values for the liquid PH3 and the experimental geometry for PCl3 are both clearly in line with the other chemical shifts, and while the fit is not quite as good in Figure 2b, it is close. Use of the −266.1 ppm gas-phase value for PH3 (as was done by Latypov [37]) for Figure 2b does not shift the scaling line significantly (giving a calculated scaled shift of −240.5 ppm) and a worse fit (MAD/RMSD = 8.5/11.6 ppm vs the 7.8/9.7 ppm shown for the −238 ppm liquid-phase value shown).
Since the absolute shielding of the reference (here σ(H3PO4)calcd) is a constant, one can equally well create a scaling equation using just the experimental vs the calculated absolute shieldings by rearrangement of Equation 1 and Equation 2 to give Equation 4, where the intercept b1 in Equation 4 simply incorporates the calculated shielding and chemical shift of the reference as shown.
![[1860-5397-19-4-i4]](/bjoc/content/inline/1860-5397-19-4-i4.svg?max-width=590&scale=1.18182)
Calculation of the absolute shielding of the reference is therefore irrelevant if one is using a scaling method, and Equation 4 gives the identical scaled chemical shifts without the need to calculate the reference shielding. In the study reported by Latypov [37], gas-phase values for the H3PO4 calculation were used for this purpose, so only the scaled chemical shifts would be expected to be valid. In the study reported by Krivdin [24], a partially experimental absolute shielding for 85% H3PO4 in water was used (σ(85% H3PO4) = 351.6 ppm), derived from the experimental chemical shift of PH3 referenced to 85% H3PO4 [53]. The use of this value has the virtue of eliminating all theoretical complications of conformations and hydrogen bonding in phosphoric acid [51], since it is not based on a DFT-optimized structure. However, the goal of Krivdin’s work was the direct calculation of chemical shifts without scaling, so that a plot of experimental vs calculated chemical shifts as in Figure 2 would give a slope of 1 and (for the H3PO4 reference) an intercept of 0; actual values were 0.977(16) and 1.2(1.7) [24]. Nevertheless, for the present work we will use Equations 1–3 as they are intuitively straightforward and provide an approximate check via the unscaled chemical shifts, and will expect to derive a scaling relationship since the level of calculation is considerably lower than that of Krivdin’s work.
4. Calculated 31P NMR chemical shifts for the Latypov test compounds. The next step, then, requires application to a variety of compounds not yet included in the training set. One such set is the set of tri- and tetracoordinate phosphorus compounds that we have already calculated chemical shifts for using the Latypov method, so if our training set is comparable to the Latypov training set, then we should obtain a similar scaling equation and similar MAD/RMSD values. In fact we do not, even though both training sets cover a similar chemical shift range with a similar number of data points. The slope of the Latypov scaling equation is 0.925, which is significantly higher than the slopes for all of the scaling equations using the tri- and tetracoordinate phosphorus compounds (i.e. that for the Latypov PBE0/PBE0 method using our training set gave a slope of 0.858, Figure 2b). The Latypov scaling equation gave a MAD/RMSD = 9.3/12.3 ppm for the tri- and tetracoordinate phosphorus compounds, so the question arose as to why the two training sets would be so different.
As described above, one difference is the choice of the PH3 chemical shift for the training set; by using the lower gas-phase value, the slope of the scaling equation will increase, as seen from 0.858 to 0.925, and the effect is amplified since this is the lowest chemical shift as seen in Figure 2. However, there are also other discrepancies. For instance, two of the highest field experimental chemical shifts are listed in the Latypov report [37] as −162.6 ppm for (H2P)2PH and −203.6 ppm for (H2P)2 [59]. Problems include (a) the Latypov group did not specify whether the PH or PH2 moiety is the one exhibiting the peak at −162.6 ppm in (H2P)2PH, (b) there is no reason both moieties should not be included, (c) the chemical shift values were determined using a complex INDOR spectrum of a mixture of compounds, exhibiting 47 lines, and so certainly subject to interpretation (and uncertainty), and (d) both (H2P)2PH and (H2P)2 exhibited multiple conformations in our hands that especially for (H2P)2PH affected the calculated chemical shifts, and (e) while we did not check all chemical shifts, the citation in reference [37] for CH2=C(H)PF2, the furthest downfield point (and hence a critical value) is wrong, although the value of 219.5 ppm is correct [60]. While these uncertainties in both the experimental and calculated chemical shifts suggest this training set may be unreliable, as seen in Figure 3 where we have plotted the Latypov data and our limited changes, these data points almost exactly cancel out in their effect on the best-fit scaling line. The MAD/RMSD of 9.5/12.4 ppm for our tri- and tetracoordinate phosphorus compounds was virtually the same as that using the original training set data reported by the Latypov group – that is, both gave an equally poor fit to the simplest phosphorus compounds.
![[1860-5397-19-4-3]](/bjoc/content/figures/1860-5397-19-4-3.png?scale=2.0&max-width=1024&background=FFFFFF)
Figure 3: Plot of experimental vs calculated chemical shifts of training set compounds reported by Latypov et al. [37] (open circles, PBE0/6-31+G(d) gas-phase optimization, PBE0/6-311G(2d,2p) gas phase NMR referenced to gas phase H3PO4), and the best fit line to give scaling Equation 2 m = 0.925 ± 0.017, b = 13.2 ± 2.5, MAD/RMSD = 9.1/10.9 ppm. Alternate data includes PH3, (H2P)2 (virtually unchanged), and both P atoms in (H2P)2PH instead (red + symbols) and best fit line to give scaling Equation 2 m = 0.926 ± 0.021, b = 11.9 ± 3.1, MAD/RMSD = 10.7/13.7 ppm.
Figure 3: Plot of experimental vs calculated chemical shifts of training set compounds reported by Latypov et...
The next step requires use of the scaling equations to calculate chemical shifts for a set of 10 “large” compounds chosen by Latypov (Figure 4; there are a number of errors in the drawings and references in the Latypov paper so they are all redrawn and referenced here) [37]. Compound 1 chosen by Latypov had many different minima upon optimization in our hands, in some cases giving widely divergent chemical shifts for the two chemically equivalent phosphorus atoms, which could potentially exacerbate any deviations from the experimental chemical shifts. Since derivatives with methyl (1a) and butyl substitution on PA were reported and had comparable chemical shifts [61], we substituted compound 1a for 1. Going forward, we used the optimization and NMR functional combinations from Table 1 that gave the lower set of MAD/RMSD values with some exceptions. First, the large IGLO-III and pcS-2 basis sets failed to overcome any deficiencies in the functional used, at least for the B3LYP case, and due to the significantly higher calculation time, these basis sets were not evaluated with other functionals. Since the IGLO-III basis set was better than the pcS-2 basis set, we kept this into the next round. In order to minimize the number of different optimization calculations, we dropped the PBE0 optimization with CHCl3 solvation and just included the Latypov gas-phase method, scaled both to our tri- and tetracoordinate phosphorus compound training set and to the original Latypov training set.
![[1860-5397-19-4-4]](/bjoc/content/figures/1860-5397-19-4-4.svg?scale=2.0&max-width=1024&background=FFFFFF)
Figure 4: “Large” compounds selected for 31P NMR calculation by Latypov [37].
Figure 4: “Large” compounds selected for 31P NMR calculation by Latypov [37].
On the basis of the MAD/RMSD criterion (Table 2), the Latypov method using the Latypov training set is superior for this collection of compounds; the substitution of 1a – which still exhibited two conformations – for 1 actually gave better results for the Latypov method than for the others, and gave a much better fit than had 1. Inspection of the deviations showed that (1) use of the large IGLO-III basis set did not provide any advantage, and (2) the B3LYP and M06-2X methods using the M06-2X optimization were mostly comparable to the Latypov PBE0 method when scaled to our collection of compounds (i.e., MAD ranging from 9.1–11.4 ppm), but not to the Latypov training set. These B3LYP and M06-2X methods initially appeared to fare worst for compounds having P–P bonds (i.e., 8–10), while the M06-2X NMR calculation for compound 1a gave a large downfield chemical shift deviation for the phosphorus atom with a multiple bond to carbon. However, the largest deviation for the P–P-bonded compounds was that of PB in 8 of up to roughly 40 ppm. An alternative hypothesis for this deviation might be that it could be due to multiple P–C bond character rather than the P–P bond itself, due to π overlap of dicoordinate PB with the naphthalene ring. The MAD/RMSD values for the limited number of data points for compounds 9 and 10 support this in that the MAD values for the M06-2X and PBE0 NMR calculations (using the tri- and tetracoordinate phosphorus scaling equation) were similar (10.6–11.1 ppm). However, the MAD value for the M06-2X NMR calculation for PB in 1a and PB in 8, that is the atoms that we propose have multiple P–C bonding, were double (25.3 ppm) the P–P MAD value.
Table 2: Experimentala and scaledb 31P NMR chemical shiftsc for Figure 4 compounds.
| Optimization functional: | B3LYP | B3LYP | M06-2X | M06-2X | PBE0 | PBE0 | |
| NMR functional: | B3LYP | B3LYP | B3LYP | M06-2X | PBE0d | PBE0d,e | |
| Basis set for NMR: | 6-311+G(2d,p) | IGLO-III | 6-311+G(2d,p) | 6-311+G(2d,p) | 6-311G(2d,2p) | 6-311G(2d,2p) | |
| Compound | Exp.f | ||||||
| 1a P(A) | 39.6 [61] | 46.8 | 45.2 | 48.4 | 56.1 | 37.2 | 40.3 |
| 1a P(B) | 297.6 | 286.3 | 280.0 | 288.1 | 338.9 | 279.1 | 303.0 |
| 2 | −110 [62] | −109.1 | −103.4 | −108.8 | −106.2 | −98.6 | −107.2 |
| 3 | −54.5 [63] | −50.7 | −47.8 | −50.1 | −47.1 | −46.5 | −50.5 |
| 4 | 24 [37] | 23.8 | 25.4 | 22.4 | 26.1 | 31.7 | 34.3 |
| 5 P(A) | 18.3 [64] | 10.2 | 11.4 | 13.0 | 20.3 | 17.3 | 18.8 |
| 5 P(B) | 27.6 | 17.9 | 19.2 | 22.2 | 28.2 | 25.2 | 27.4 |
| 6 | −10.2 [65] | 3.0 | 4.5 | 0.1 | −5.7 | −7.5 | −8.1 |
| 7 | 38.7 [66] | 45.0 | 42.7 | 39.3 | 44.8 | 43.9 | 47.7 |
| 8 P(A) | 76.7 [67] | 74.9 | 77.7 | 74.9 | 75.3 | 67.2 | 72.9 |
| 8 P(B) | −157.7 | −110.6 | −112.4 | −121.8 | −115.5 | −135.6 | −147.3 |
| 9 P(A) | −29.7 [68] | −4.8 | −3.9 | −19.6 | −24.4 | −23.6 | −25.7 |
| 9 P(B) | 100.5 | 90.7 | 91.7 | 85.5 | 94.5 | 84.5 | 91.7 |
| 9 P(C) | −10.6 | 15.4 | 14.5 | 15.1 | 13.4 | 6.3 | 6.7 |
| 9 P(D) | 75.7 | 64.3 | 66.1 | 65.4 | 72.5 | 62.7 | 68.1 |
| 10 P(A) | −22.6 [69] | 1.0 | 2.6 | −5.9 | −9.8 | −19.0 | −20.6 |
| 10 P(B) | 84.1 | 105.8 | 104.5 | 93.3 | 99.1 | 76.1 | 82.6 |
| MADg | 13.3 | 13.7 | 10.1 | 11.4 | 9.1 | 5.3 | |
| RMSDg | 17.7 | 17.7 | 13.5 | 17.0 | 11.0 | 7.0 | |
| 9, 10 (P–P)h | |||||||
| MAD | 19.6 | 19.2 | 14.5 | 11.1 | 10.6 | 6.9 | |
| RMSD | 20.6 | 20.5 | 15.6 | 13.2 | 11.7 | 8.7 | |
| 1a, 8 (P=C))i | |||||||
| MAD | 16.8 | 17.3 | 14.0 | 25.3 | 13.1 | 5.1 | |
| RMSD | 24.5 | 24.4 | 19.1 | 30.7 | 15.2 | 6.2 | |
| 2–7, 9, 10j | |||||||
| MAD | 12.3 | 12.6 | 8.9 | 7.1 | 7.8 | 5.4 | |
| RMSD | 15.0 | 15.1 | 11.2 | 9.5 | 9.3 | 7.2 | |
aExperimental chemical shifts referenced to external 85% H3PO4 at 0.00 ppm, positive values downfield. bNMR calculations were carried out using GIAO with IEF-PCM solvation on optimized structures (DFT/6-31G+(d,p)/IEF-PCM) except as noted for the last two columns; the IGLO-III basis set was taken from the Basis Set Exchange [70], and all other basis sets were taken from Gaussian. Except as noted for the final column, all calculations scaled using the tri- and tetracoordinate training set. cChemical shifts calculated from the absolute isotropic chemical shieldings according to Equation 1 (Tables S6–S8 in Supporting Information File 1), where H3PO4 was optimized and its NMR was calculated using the same basis sets and functionals, and except for the final two columns, IEF-PCM using water, and scaled using parameters in S4 (Equation 2) giving scaled shifts (Supporting Information File 1, Table S9, Equation 3). dOptimized (PBE0/6-31+G(d)/gas phase), NMR (PBE0/6-311G(2d,2p)/gas phase), and H3PO4 reference (gas phase) following Latypov [37]. eScaled using the Latypov training set, and values for 2–10 taken from Latypov [37]. fCompounds 1a–4 were measured and calculated in benzene, and 5–10 in chloroform. gSee note a in Table 1. hMAD/RMSD (ppm) for compounds that contain a P–P bond with no P–C multiple bonding. iMAD/RMSD for compounds with P–C multiple bonding. jMAD/RMSD (ppm) for compounds that contain no P–C multiple bonding.
At least part of the cause for the P–P chemical shift deviations might be that the Latypov method gives better agreement of the P–P bond lengths with those observed by X-ray, but simply using the X-ray structure geometries with the other functionals (or even with the PBE0 functional) does not give better agreement of the calculated to the experimental chemical shifts. That is, the P–P bond length in compound 8 is 2.147(6) Å by X-ray [67] and is 2.143 Å using the Latypov PBE0/6-31+G(d)/gas-phase optimization method. This optimized geometry gave a scaled NMR (PBE0/6-311G(2d,2p)/gas phase) of −147.3 ppm compared to the experimental chemical shift of −157.7 ppm. The P–P bond length was 2.175 Å and 2.156 Å using the B3LYP and M06-2X optimizations, respectively, giving scaled chemical shifts of −115 to −120 ppm for the former and −116 and −128 ppm for the latter optimization. Calculation of the scaled chemical shifts using the X-ray geometry gave −133.5 and −121.8 ppm for the B3LYP and M06-2X functionals, so clearly the more accurate M06-2X bond length did not give better agreement with the experimental chemical shift. A similar bond length comparison was seen for compounds 9 and 10, where the PBE0 functional gave P–P bond lengths that were closest to the X-ray geometries, but using the X-ray geometry for the B3LYP and M06-2X NMR functionals gave some improved and some far worse calculated NMR chemical shifts. Clearly the problems with both the B3LYP and M06-2X NMR calculations are with the functionals themselves, not the geometries.
In order to test if the P–C multiple bond effect was reproducible, we optimized 3,4-dimethylphosphabenzene (a training set compound chosen by Latypov, with experimental and scaled chemical shifts of 187.9 [71] and 197.4 [37] ppm) and found the scaled chemical shift was 175.1 ppm for the M06-2X (optimization) and B3LYP (6-311+G(2d,p) NMR) combination, but was 225.2 ppm when the M06-2X functional was used for both the optimization and NMR. As will be seen below, this chemical shift calculation failure was seen in all the subsequent cases we examined that have P–C multiple bonding when the M06-2X functional was used for the NMR calculation.
The results in Table 2 show that the Latypov functionals, used without any solvation and with the Latypov training set for scaling, gave the best fit for these 10 compounds (MAD/RMSD = 5.3/7.0 ppm). Use only of our different training set gave a significantly worse fit (MAD/RMSD = 9.1/11.0 ppm), showing that Jensen’s point that choice of functional resembles data fitting [8] can also be applied to choice of training set. Following removal of the multiple bonded P–C chemical shifts, the Latypov scaling was still best (and essentially unchanged) but the M06-2X NMR method was closer (MAD/RMSD = 7.1/9.5 ppm) and was better than the Latypov method scaled with the alternate training set (MAD/RMSD = 7.8/9.3 ppm).
5. Calculated 31P NMR chemical shifts for stereoisomers and unusual structures. We next chose our own set of phosphorus compounds (Figure 5, 11–29; for simplicity compounds 30–34[O] discussed later are included in the MAD/RMSD values here). This was done to to determine if the calculation and scaling would be accurate enough to distinguish stereoisomers via chemical shifts rather than coupling constants [72,73] and provide confirmation of unusual structures and chemical shifts, and with the further stipulation that multiple P–C bonding would likely give inaccurate M06-2X NMR calculations (Table 3; results with the IGLO-III basis set are included in Supporting Information File 1, Tables S6–S9, and as expected gave higher MAD/RMSD values). The M06-2X (optimization) and B3LYP (NMR) functional combination gave the best MAD/RMSD, and the relatively low RMSD is consistent with the fact that there were no glaring discrepancies in experimental and calculated chemical shifts, both for the initial group of 1a–10 (Table 2) and the new group of 11–34[O]. As expected the M06-2X functional gave the highest values when it was used for the NMR calculation due to the presence of compounds with P–C multiple bonds. In all cases for the sets of stereoisomers (i.e., 11/12, 13/14, 15/16, 17/18, and 27/28), the correct order of calculated upfield and downfield shifts was observed, although the calculated difference between the cis and trans isomers tended to be larger than the experimental difference for the trivalent compounds. Conformational differences play a role here, particularly for the six-membered rings in compounds 15–18, where the twist boat conformations can be the major isomers in solution [74] (see Table 3 footnotes and Supporting Information File 1 for details), although care was taken to find all important conformations to be included in the NMR calculations.
![[1860-5397-19-4-5]](/bjoc/content/figures/1860-5397-19-4-5.svg?scale=2.0&max-width=1024&background=FFFFFF)
Figure 5: Stereoisomers and unusual phosphorus compounds used for chemical shift calculations.
Figure 5: Stereoisomers and unusual phosphorus compounds used for chemical shift calculations.
Table 3: Experimentala and scaledb 31P NMR chemical shiftsc for the compounds shown in Figure 5, Figure 6, and Figure 7.
| Optimization functional: | B3LYP | M06-2X | M06-2X | PBE0 | |
| NMR functional: | B3LYP | B3LYP | M06-2X | PBE0d | |
| Compound | Exp.e | ||||
| 11f | 152.9 [75] | 156.9 | 153.3 | 152.1 | 166.5 |
| 12 f | 139.3 [75] | 142.0 | 138.5 | 139.3 | 150.6 |
| 13 | 133.0 [76] | 133.8 | 125.4 | 125.0 | 128.8 |
| 14f | 136.7 [76] | 144.8 | 128.8 | 132.0 | 138.8 |
| 15f | 132.2[74] | 129.3 | 126.4 | 124.7 | 137.5 |
| 16f | 138.5 [74] | 142.1 | 137.2 | 134.8 | 150.3 |
| 17f | 125.8 [74] | 128.6 | 126.2 | 124.9 | 133.7 |
| 18f | 145.3 [74] | 146.7 | 144.5 | 142.3 | 152.8 |
| 19g | 169 [77] | 181.3 | 178.9 | 172.3 | 186.0 |
| 20g | 153 [77] | 147.8 | 146.4 | 148.7 | 169.2 |
| 21h | 355.7 [78] | 350.9 | 355.2 | 398.1 | 372.4 |
| 21 (Ph3P) | 26.2 | 20.7 | 19.2 | 23.8 | 20.9 |
| 22i | 302 [79] | 310.4 | 299.7 | 350.9 | 306.4j |
| 23 | −127.2 [80] | −125.7 | −124.8 | −107.0 | −130.0 |
| 24 | −151.0 [80] | −129.0 | −131.2 | −120.6 | −140.3 |
| 25 | 63.5 [81] | 64.7 | 68.7 | 73.6 | 63.6 |
| 26 | 187.9 [71] | 181.7 | 182.1 | 224.9 | 197.3 |
| 27f | 13.9 [82] | 11.0 | 12.3 | 17.7 | 19.6 |
| 28 | 16.0 [82] | 14.2 | 15.4 | 20.6 | 22.7 |
| 29g | 93 [77] | 80.8 | 97.1 | 104.6 | 94.1 |
| anti-30 | 24.2 [83] | 34.8 | 25.2 | 17.9 | 18.8 |
| syn-30f | 11.3 [83] | 23.5 | 15.6 | 9.1 | 7.8 |
| anti-30[O] | 54.1 [83] | 44.8 | 42.1 | 45.4 | 44.7 |
| syn-30[O]f | 61.8 [83] | 49.7 | 46.3 | 49.3 | 50.1 |
| anti-31 | −24.4 | −12.1 | −29.2 | −27.9 | −31.2 |
| syn-31 | −21.8 | −0.9 | −21.4 | −19.6 | −22.2 |
| 32f | −181 | −59.2 | −169.3 | −180.1 | −119.8 |
| 33 | −79 | −78.8 | −74.7 | −72.1 | −90.3 |
| 34 | −14 | −3.6 | −11.2 | −10.0 | −20.4 |
| 33[O] | 38 | 27.2 | 30.3 | 36.3 | 24.6 |
| 34[O] | 26 | 12.6 | 13.7 | 20.8 | 11.0 |
| 11–34[O] | |||||
| MAD/RMSDk | 11.1/23.7 | 5.4/7.3 | 9.7/15.8 | 9.8/14.4 | |
| 1a–34[O] | |||||
| MAD/RMSD | 11.9/21.8 | 7.1/9.9 | 10.3/16.3 | 8.2/12.3 | |
| 2–7, 9–20, 27–34[O]l | |||||
| MAD/RMSD | 12.0/22.8 | 6.4/8.5 | 5.4/7.1 | 8.7/13.1 | |
a,b,c,dSee notes a–d for Table 2; NMR basis sets and solvation were 6-311+G(2d,p) and CHCl3 except for PBE0 (6-311G(2d,2p) and gas phase). eCompounds 11, 12, and 30–31 were optimized and the NMR spectra calculated in toluene, 13, 14, 19, 20, 25, 26, 29, and 32–34[O] in chloroform, 15–18, 23, 24, 27, and 28 in benzene, 21 in dichloromethane, and 22 in acetonitrile. fMajor conformations shown in Figures 5–7 but compounds 11, 12, 14, 16–18, 27, syn-30, syn-30[O], and 32 exhibit multiple conformations; for 16 twist-boat 1 and twist-boat 2 are significant, and for 17 the chair and twist boat 1 are significant; for 15 only the chair was significant (Table S7, Supporting Information File 1). gOptimizations and NMR calculations were carried out on the compounds without the methyl groups para to the oxygen atoms due to problems with convergence because of methyl rotation; no significant chemical shift differences were seen. hBF4¯ rather than the actual AlCl4¯ ions were used in the calculations to minimize the size of the calculation. iPF6¯ and Cl¯ ions rather than the actual SbF6¯ and Br¯ ions were used in the calculations to minimize the size of the calculation. jIn the absence of solvation the trication structure could not be optimized in the presence of anions so this calculation is for the trication alone. kSee note a in Table 1. lCombined MAD/RMSD for all compounds in Table 2 and Table 3 with no multiple P–C bonds.
Unusual structures such as phosphenium cation 20, having a chemical shift upfield of the trivalent chloride 19, contrary to expectation where the cation is typically 100 ppm downfield of the corresponding chloride [77,84-86], were confirmed by each of the calculation methods, as were the remarkably downfield shifts for the novel di- and trications 21 and 22, for which even drawing suitable resonance structures is a challenge. Two phosphinidenes (23, 24), i.e., carbene analogues with potentially anionic phosphorus atoms, have remarkably upfield chemical shifts that are once again confirmed by the calculated values. Both of the P–C bond lengths are indicative of single bond character albeit relatively short (both the X-ray [80] and DFT structures), although the large downfield deviations for the M06-2X NMR calculation suggest multiple P–C bonding – perhaps a novel use of this DFT failure.
The acylphosphonodiamidite 25 is another novel structure confirmed by the chemical shift calculation, although the largest deviation was seen for the M06-2X NMR calculation, again perhaps suggesting multiple P–C bonding. The case for multiple P–C bonding in compound 25 is supported by the amide-like CO infrared stretching frequency of 1654 cm−1. This compound further warrants mention since one might suppose that the carbonyl carbon atom would be found near 170 ppm in the 13C NMR spectrum by analogy to amides, but was instead observed at 228 ppm and confirmed by a calculated (unscaled) value of 242 ppm [81]! Such a result demonstrates the value of DFT calculations for structures not having any experimental NMR precedent.
We include here phosphabenzene 26 [71], which as noted above was used as part of the Latypov training set, for these four methods. As expected the calculations confirm the failure of only the M06-2X NMR method for compounds with multiple P–C bond character.
We finish with two challenging examples, one a relatively recent report by the Radosevich group of a novel catalytic oxygen transfer reaction involving four-membered ring phosphorus compounds [83], and one involving a 57-year old report by the Katz group of the first characterized three-membered ring phosphorus heterocycle [87]. The four-membered ring phosphetanes and proposed intermediate structures (30, 30[O], 31, Figure 6) provide examples of novel structures [83] where stereochemistry is also confirmed by calculations, even for the challenging intermediates anti and syn-31. The authors of that study chose to optimize the structures using the M06-2X functional with the 6-311++G(d,p) basis set, but we found that the smaller 6-31+G(d,p) basis set that we had been using was adequate. Each of the methods allowed the stereoisomers to be distinguished, although the optimization and NMR with the B3LYP functional was much worse (MAD/RMSD = 12.9/13.4 ppm) while the M06-2X optimization and NMR was the best (MAD/RMSD = 5.9/7.0 ppm). We also note that the calculated chemical shifts reported in the phosphetane study [83] were referenced to anti-30 rather than H3PO4, while here all the values were calculated with reference to H3PO4, before being scaled.
![[1860-5397-19-4-6]](/bjoc/content/figures/1860-5397-19-4-6.svg?scale=2.0&max-width=1024&background=FFFFFF)
Figure 6: Phosphorus-catalyzed oxygen transfer reaction intermediates.
Figure 6: Phosphorus-catalyzed oxygen transfer reaction intermediates.
As the final example, Katz reported in 1966 [87] the reaction of cyclooctatetraene dianion with PhPCl2 to give a single phosphine product 32 having an unusually high field 31P NMR chemical shift of −181 ppm. Compound 32 underwent a stereospecific thermal [1,5]-sigmatropic rearrangement to bicyclic 33 exhibiting a 31P NMR chemical shift of −79 ppm. Pyrolysis of 33 at 480 °C gave isomeric 34 having a 31P NMR chemical shift of −14 ppm, while H2O2 oxidation of compounds 33 and 34 gave the corresponding phosphine oxides 33[O] and 34[O] with chemical shifts of 38 and 26 ppm, respectively (Figure 7). Identification of the isomers by 31P NMR would represent a nice example of the utility of the calculations described here. Results for 33, 34, 33[O], and 34[O] all confirmed the 1966 identifications (although the deviations are smallest for the two M06-2X optimization methods), but the 31P NMR of the compound of primary interest, 32, differed by 61 ppm from the calculated value using the Latypov method and 122 ppm using the B3LYP optimization, but gave excellent agreement using the M06-2X optimization, especially with the M06-2X NMR calculation (Table 3)! The X-ray structure of 32 was reported in 2004 [88,89] so the identification is correct, and provides a surprisingly extreme example of how these DFT functionals can differ. Comparison of bond lengths showed that this might be due to sensitivity of the DFT chemical shift to bond lengths. The three-membered phosphorus ring in the X-ray structure exhibited C–C and average C–P bond lengths of 1.495(2) and 1.869(5) Å, while the values for the M06-2X, Latypov, and B3LYP optimizations were 1.495/1.869, 1.488/1.882, and 1.489/1.908 Å, respectively. This suggested that the virtually exact match of the M06-2X optimization with the X-ray structure contributed to the agreement of the NMR calculation with the experimental chemical shift. Consistent with this, calculation of the NMR chemical shifts using the X-ray structure geometry also gave near perfect fits to the experimental for the B3LYP and PBE0 functionals. However as noted above use of the X-ray geometries of 8–10 with the B3LYP and M06-2X NMR functionals showed that the poor agreement of the NMR chemical shift calculations was due to the NMR functionals, not the geometries used.
![[1860-5397-19-4-7]](/bjoc/content/figures/1860-5397-19-4-7.svg?scale=2.0&max-width=1024&background=FFFFFF)
6. The search for a failure-free functional. Looking at the complete collection of compounds evaluated (Table 2 and Table 3), the best MAD/RMSD (7.1/9.9 ppm) for 1a–34[O] was seen for the M06-2X optimization and B3LYP NMR. As seen in the last row of Table 3, elimination of the failures due to compounds with P–C multiple bonding character gave the best MAD/RMSD = 5.4/7.1 ppm for optimization and NMR calculations both with the M06-2X functional. Clearly we are looking at a better “fitting” functional as described by Jensen [8], but what truly distinguishes these 31P NMR results from the better-studied 1H and 13C results is the existence of the 31P NMR failures.
The failures that we encountered included (1) the P–C multiple bonds for the M06-2X NMR calculations (i.e., 1a), (2) possibly P–P bonding for both the M06-2X and B3LYP NMR calculations (i.e., 8 and to a lesser extent 9 and 10), and (3) the phosphirane 32 for the B3LYP/B3LYP method and the PBE0 method of Latypov. We therefore set out to look at these outliers with recently recommended functionals rather than the widely-used functionals [15,90] that we have already tried (i.e., B3LYP, PBE0, M06-2X). In this way we might hope to see if this could provide a short-cut to find the best NMR functional, that is, one that might give the best fit with the least scatter (i.e., the lowest MAD), but also with none of the failures.
A recent review assessed 200 density functionals [91] and assigned them to the five rungs of “Jacob’s ladder” [92-95]. In principle these 200 functionals could be evaluated for our 31P NMR chemical shift problem, but in that same review Mardirossian and Head-Gordon noted that while DFT methods have been successfully used for chemical shift calculations, magnetic properties are not included in conventional functional development nor in the energy benchmarks that are used. Instead, we looked at recent work, mostly on 13C NMR spectroscopy, for recommendations [7,90,91,96-98].
Results are collected in Table 4 for the chemical shifts for compounds 1a, 8, and 32, scaled using only the first and last points for the trivalent series, PCl3 and PH3 (see Computational and NMR Details below). Comparison of the two-point scaling values for entries 1–4 in Table 4 with the full linear regression for scaling in Table 2 and Table 3 validates this short-cut. The GIAO NMR method was used for all of the calculations described to this point, as well as for the commonly recommended methods for 1H and 13C calculations [15]. However, the first method to be tried for this group of three compounds utilized the alternative CSGT NMR method recommended by Iron [7] with the TPSSTPSS [92,99,100] functional for the NMR calculation (albeit we used the computationally less intensive basis sets and the M06-2X optimization method already employed). As seen in entry 5 (Table 4) the GIAO method gave no improvement over entries 3 and 4, but use of the recommended CSGT method did give a reduction in the MAD (Table 4, entry 6). Optimization with the TPSSTPSS functional followed by the TPSSTPSS/CSGT NMR (Table 4, entry 7) failed, especially for compound 32. Iron further found that long-range corrected (LC) functionals all out-performed the non-corrected functionals, so this was tested as seen by entries 8 and 9 (Table 4) for both the GIAO and CSGT calculation. The GIAO entry was only slightly better while the CSGT entry was worse, but more interestingly, both failed for the P–C multiple-bonded case, giving chemical shifts over 80 ppm downfield from the non-long-range corrected calculations for PB in 1a (Table 4, entries 5 and 6). The related PBETPSS functionals recommended by Modrzejewski et al. [98] exhibited the identical downfield failure for P–C multiple bonding (Table 4, entries 10–13) upon adding in the LC calculation. An obvious hypothesis for the M06-2X P-C multiple bonding NMR failure therefore was that this functional employs too much long-range correction, and Truhlar has described it as a medium-range method [57,101]. We therefore tried the local version of the M06-2X functional, namely the M06-L functional [102], for the NMR calculation (Table 4, entries 14–16), and were rewarded with the best MAD for these three compounds when using the M06-2X optimization and the M06-L/GIAO NMR calculation (Table 4, entry 14). Interestingly, this functional was not recommended in a recent study on calculation of solid-state chemical shifts for 31P NMR [103]. Use of the CSGT NMR method gave a higher MAD (Table 4, entry 15) and M06-L optimization gave a very poor result (entry 16). Use of the newer local M11-L functional [104] for the NMR however was much worse (Table 4, entries 17 and 18) due entirely to the poor fit of 1a when using M06-2X optimization but all four chemical shifts were poor (even PA in 1a, used essentially as a control) using M11-L optimization. Two fourth rung [90] functionals, M11 and MN12-SX [105,106], also failed to give any improvement (Table 4, entries 19 and 20), and these were also worse than the older fourth rung [90] functional M06-2X. Grimme’s D3 dispersion correction has been recommended for general use as it increases the accuracy of many calculations [97,98], particularly with the BLYP functional (Table 4, entry 21) [97], but for the cases we tried no improvement was seen (Table 4, entries 21–24). Last, Modrzejewski et al. [98] noted that Head-Gordon’s ωB97X-D, a long-range corrected range-separated functional with dispersion correction [96], was also found to be highly accurate, and it was the most recently developed of the five representative functionals chosen by Jensen for evaluation [8]. Somewhat surprisingly, given the long-range correction that we previously found had resulted in the failure of P–C multiple bonding calculation, this functional (Table 4, entries 25 and 26) gave two of the best MAD values, with optimization either by the M06-2X or ωB97X-D functionals. Last, given the success of many of the M06-2X optimizations here and the Latypov PBE0 method, it seemed appropriate to test that (Table 4, entry 27). Here the PBE0 NMR calculation was carried out in the same way as entries 2–26, with CHCl3 solvation and the 6-311+G(2d,p) basis set, and as seen it gave one of the best results.
Table 4: Scaled (using PH3 and PCl3) chemical shifts for the “failures” 1a, 8, and 32 for various optimization and NMR functionals.
| Entry | Optimization | NMRa | 1a PA | 1a PB | 8 PB | 32 | MADb |
| experimental | 39.6 | 297.6 | −157.7 | −181 | |||
| 1 | PBE0 (Latypov) | PBE0 (Latypov) | 37.2 | 282.5 | −139.6 | −112.7 | 33.9 |
| 2 | B3LYP | B3LYP | 42.1 | 278.4 | −114.2 | −59.2 | 61.5 |
| 3 | M06-2X | B3LYP | 40.3 | 272.2 | −125.7 | −167.9 | 23.5 |
| 4 | M06-2X | M06-2X | 56.2 | 336.0 | −115.1 | −175.2 | 28.9 |
| 5 | M06-2X | TPSSTPSS | 36.9 | 256.4 | −135.8 | −164.1 | 26.7 |
| 6 | M06-2X | TPSSTPSS* | 34.3 | 260.3 | −148.1 | −173.3 | 18.2 |
| 7 | TPSSTPSS | TPSSTPSS* | 31.8 | 259.0 | −132.9 | −20.9 | 74.5 |
| 8 | M06-2X | LC-TPSSTPSS | 38.1 | 339.4 | −132.4 | −184.8 | 23.6 |
| 9 | M06-2X | LC-TPSSTPSS* | 33.4 | 345.0 | −149.8 | −199.0 | 24.4 |
| 10 | M06-2X | PBETPSS | 44.1 | 260.1 | −124.5 | −152.2 | 33.1 |
| 11 | M06-2X | PBETPSS* | 41.4 | 264.4 | −139.0 | −162.3 | 23.5 |
| 12 | M06-2X | LC-PBETPSS | 40.9 | 342.1 | −127.4 | −178.4 | 25.8 |
| 13 | M06-2X | LC-PBETPSS* | 35.0 | 348.7 | −147.5 | −195.4 | 25.3 |
| 14 | M06-2X | M06-L | 36.5 | 274.4 | −156.7 | −180.9 | 8.1 |
| 15 | M06-2X | M06-L* | 32.1 | 278.1 | −171.5 | −190.8 | 14.4 |
| 16 | M06-L | M06-L | 27.4 | 257.4 | −161.4 | −61.5 | 54.5 |
| 17 | M06-2X | M11-L | 23.6 | 231.5 | −156.5 | −181.8 | 22.7 |
| 18 | M11-L | M11-L | 7.8 | 212.3 | −172.6 | −70.1 | 70.4 |
| 19 | M11 | M11 | 43.8 | 339.8 | −124.9 | −194.4 | 29.5 |
| 20 | MN12-SX | MN12-SX | 27.2 | 274.6 | −154.9 | −145.6 | 20.4 |
| 21 | BLYP-D3 | BLYP-D3 | 34.4 | 242.3 | −100.1 | −7.6 | 95.4 |
| 22 | M06-2X-D3 | M06-2X-D3 | 56.1 | 336.0 | −115.0 | −175.2 | 29.0 |
| 23 | M06-L-D3 | M06-L-D3 | 27.3 | 257.4 | −161.3 | −61.5 | 54.4 |
| 24 | TPSSTPSS-D3 | TPSSTPSS-D3* | 31.8 | 259.6 | −140.5 | −23.1 | 71.0 |
| 25 | M06-2X | ωB97X-D | 39.3 | 293.1 | −132.8 | −177.7 | 10.9 |
| 26 | ωB97X-D | ωB97X-D | 38.0 | 292.8 | −136.9 | −174.2 | 10.8 |
| 27 | M06-2X | PBE0 | 43.3 | 285.1 | −133.2 | −169.0 | 16.3 |
aCSGT method indicated by *; all others are GIAO. bMAD for 1a isomer A PB, 8 PB, and 32 isomer A; scaled chemical shifts for 1a isomer A PA (which has a P–C single bond) are shown for comparison but are not included in the MAD calculation, and scaled chemical shifts for 8 PA are not included because these are correctly calculated by all methods previously (Table 2).
The optimization/NMR methods that gave the lowest MAD values in Table 4 (entries 6, 14, 25–27, apart from entry 15 which was worse than the related entry 14) were then used for the full set of tri- and tetracoordinate compounds for scaling, and then the full set of test compounds 1a–34[O]; MAD/RMSD results are listed in Table 5 (see Supporting Information File 1, Tables S7 and S10–S17 for all data) along with comparisons to the four best prior methods in Table 4 (entries 1, 3, and 4). As can be seen by examination of the results for the training set of tri- and tetracoordinate compounds in the first column, two of the new combinations, namely the M06-2X/PBE0 and the M06-2X/ωB97x-D functionals for optimization and NMR calculations, were among the best for the MAD/RMSD values in Table 1 and Table 5. These two also exhibited the lowest MAD/RMSD values of 6.9/8.5 and 6.8/9.1 ppm, respectively, for the full set of test compounds 1a–34[O]. The higher RMSD for the M06-2X/ωB97x-D combination is due to the relatively large number of scaled chemical shifts that differ by 18–26 ppm from the experimental chemical shifts, while the M06-2X/PBE0 combination exhibits only one of those large chemical shift deviations. The next best M06-2X/M06-L combination (MSD/RMSD = 7.5/9.3 ppm) exhibits four such large deviations, although it was the best for the troublesome PB of 8. In fact, the only other combination that has only one large deviation is Latypov’s gas-phase PBE0/PBE0 calculation, and as described above that is the phosphirane 32, with a scaled chemical shift calculation of −120 ppm compared to the experimental value of −181 ppm. Without that one data point, the MAD/RMSD drops from 8.2/12.3 ppm to 7.1/8.6 ppm, which is one of the best results. As seen in Figure 8, plotting the experimental chemical shifts against the scaled calculated values for 1a–34[O] for the M06-2X/PBE0 and the Latypov PBE0/PBE0 combinations each gives a set of values very close to the desired straight line with a slope of 1 and an intercept of 0, except for the one failure for compound 32 as shown; by inspection it can be seen that the Latypov plot does exhibit more scatter about the perfect fit line, so the higher MAD/RMSD for the points other than that for 32 makes sense.
Table 5: Comparison of the besta functionals for 1a–34[O].
| MAD/RMSD (ppm) | ||||||
| Opt/NMRb | P3 and P4 training set | 1a–34[O] | P–P: 8–10 | 1a–7, 11–34[O] | P=C: 1a, 8PB, 21–26 | 2–8PA, 9–20, 27–34[O] |
| M06-2X/B3LYP | 6.5/8.0 | 7.1/9.9 | 15.6/18.5 | 5.4/7.1 | 9.7/14.0 | 6.4/8.5 |
| M06-2X/ M06-2X | 4.1/5.7 | 10.3/16.3 | 13.7/18.8 | 9.7/15.7 | 29.1/32.8 | 5.4/7.1 |
| PBE0/PBE0c | 7.8/9.7 | 8.2/12.3d | 6.9/8.5 | 8.5/12.9 | 6.6/8.2 | 8.7/13.1 |
| M06-2X/M06-L | 7.2/8.8 | 7.5/9.3 | 9.3/10.7 | 7.2/9.0 | 8.2/9.6 | 7.4/9.2 |
| M06-2X/TPSSTPSS*e | 6.7/8.2 | 8.7/12.1 | 11.8/13.1 | 8.0/11.8 | 17.2/20.7 | 6.4/8.4 |
| M06-2X/ωB97x-D | 5.9/7.3 | 6.8/9.1 | 11.6/13.8 | 5.8/7.9 | 10.4/13.9 | 5.9/7.4 |
| ωB97x-D/ωB97x-D | 6.1/7.5 | 7.4/9.4 | 11.0/13.3 | 6.6/8.4 | 9.8/12.6 | 6.7/8.3 |
| M06-2X/PBE0 | 5.8/7.1 | 6.9/8.5 | 10.8/13.0 | 6.1/7.2 | 8.4/10.7 | 6.5/7.7 |
aBest results are in bold. bFunctionals for optimization (6-31+G(d,p) basis set) and NMR (6-311+G(2d,p) basis set), both with CHCl3 solvation (IEF-PCM) except as noted. cOptimization and NMR following Latypov, gas phase and 6-31+G(d) and 6-311G(2d,2p) basis sets, respectively. dWithout 32, MAD/RMSD = 7.1/8.6 ppm. eCSGT NMR method; all others are GIAO.
![[1860-5397-19-4-8]](/bjoc/content/figures/1860-5397-19-4-8.png?scale=2.0&max-width=1024&background=FFFFFF)
Figure 8: (a) Plot of experimental vs scaled chemical shifts derived from the tri- and tetracoordinate phosphorus training set compounds (M06-2X optimization and PBE0 NMR (6-311+G(2d,p) basis set) referenced to H3PO4, IEF-PCM CHCl3 solvation; see Supporting Information File 1, Table S17 for values). The line drawn (slope = 1, intercept = 0) is the perfect fit line. (b) Plot of experimental vs scaled chemical shifts derived from the Latypov training set compounds (PBE0 optimization and PBE0 NMR (6-311G(2d,2p) basis set) referenced to H3PO4, no solvation; see Supporting Information File 1, Table S9 for values). The line drawn is the perfect fit line.
Figure 8: (a) Plot of experimental vs scaled chemical shifts derived from the tri- and tetracoordinate phosph...
We conclude this section by examining separation of the P–P-bonded compounds or the P–C multiple-bonded compounds. Separating out first the P–P-bonded compounds 8–10 showed that the Latypov PBE0/PBE0 method was by far the best for those compounds, with the M06-2X/M06-L method that gave the best calculated chemical shift for PB in 8 (−148.0 vs −157.7 ppm for the experimental value) the only other method that was close; the M06-2X/B3LYP method was the worst. When compiling the MAD/RMSD values for the remaining non-P–P-bonded compounds 1a–7 and 11–34[O], the overall results were somewhat better and the M06-2X/B3LYP method was the best. On the other hand, when the P–C multiple-bonded compounds 1a, 8(PB), and 21–26 were separated out, the failure of the M06-2X/M06-2X was confirmed (MAD/RMSD = 29.1/32.8 ppm), and surprisingly the M06-2X/TPSSTPSS* method also failed (MAD/RMSD = 17.2/20.7 ppm) – surprising since this had been selected in the screening method. The Latypov PBE0/PBE0 method was once again the best for this subset, with the M06-2X/M06-L and M06-2X/PBE0 methods the only others that were close. When these multiple-bonded compounds were eliminated from the test set and the MAD/RMSD values compiled for 2–8(PA), 9–20, and 27–34[O], however, the M06-2X/M06-2X was best (MAD/RMSD = 5.4/7.1 ppm).
Conclusion
We have developed a method for accurate calculation of 31P NMR chemical shifts using a training set of well-known tri- and tetracoordinate phosphorus compounds that allows scaling of the readily accessible DFT chemical shifts. The present method follows established norms [15] of optimization of compound geometries in solution and weighting of the calculated chemical shifts on the basis of calculated equilibrium ratios in solutions of the different conformers. We compare this to the previously reported method described by Latypov [37], which uses a somewhat eclectic mix of unusual phosphorus compounds, some of which have questionable chemical shifts, and that are optimized using gas-phase calculations. The Latypov method, using the PBE0 functional for both optimization of compound geometry and chemical shift calculation, was found to be superior for compounds that contain P–P bonds and P–C multiple bonds. Optimization with the M06-2X functional was found to be superior for all compound types except the P–P-bonded compounds when the B3LYP functional was used for the chemical shift calculation, and the M06-2X functional was also found to be superior for all compound types except the P–C multiple-bonded compounds when the M06-2X functional was used for the chemical shift calculation.
One of the goals of this work was that the calculated chemical shifts should be sufficiently accurate to distinguish stereoisomers and confirm structures of unusual compounds. In fact, the methods were able to correctly reproduce the relative chemical shifts of stereoisomers that differed by as little as 3 ppm. However, for the unusual compounds, some combinations of functionals failed for confirmation of structures that contained multiple P–C bonding, P–P bonding, and for a 3-membered phosphirane ring. For instance, use of the M06-2X functional for both optimization and NMR calculations gave large downfield shifts of 30–49 ppm from the experimental values if there was any P–C multiple-bonding character, and B3LYP and PBE0 optimization led to downfield shifts of 61–124 ppm from the experimental value for the phosphirane ring. The P–P bonding failure is less clear, with downfield shift failures of 20–47 ppm for PB in 8 for all pairs of functionals except the Latypov PBE0/PBE0 method and the M06-2X/M06-L combination, both of which gave downfield shifts of 10 ppm. A screening method was used to allow rapid calculations of scaled values to detect methods that would avoid these three failures, in hopes that this might lead to better overall methods. The results show that the strategy of screening methods using the “failures” did in fact lead to improvements in calculations, including a potential method using a localized version (M06-L) of the M06-2X functional for the NMR, and the two best methods for general use: the best combination involved optimization using the M06-2X functional with NMR calculations using the PBE0 functional, and use of the ωB97x-D functional for the NMR calculations was a close second. For compounds without P–P bonds, the M06-2X/B3LYP combination, on the basis of fairly limited data, can be used, and for compounds without P–C multiple bonds, the M06-2X/M06-2X combination is a good choice. For compounds with those functionalities, the Latypov method is best. Given the unexpected failures noted, for compounds with novel structures not covered here, more than one method should be used.
On the interesting question posed by Jensen [8] on whether the search for the “best” functionals and basis sets for chemical shift scaling is an exercise in data fitting, we note that unlike the case for 1H and 13C chemical shifts, 31P chemical shifts must depend on a far more variable collection of phosphorus bond lengths and geometries. The functionals that give the most accurate bond lengths to phosphorus might give the best calculated chemical shifts, but changing the bond lengths to the correct lengths using the X-ray geometries does not necessarily then yield the correct chemical shifts as described in detail for 8 and in brief for 9 and 10, and of course this is not a viable strategy to confirm novel and unknown structures. In the failure of the M06-2X functional with multiple bonding, the cause is clearly not due to failure to give proper bond lengths, as chemical shifts using the B3LYP functional are reliable using the identical M06-2X optimized structures. The decrease in scatter using the M06-2X optimization, however, can be considered as improved data fitting as described by Jensen [8], but the failures, including P–P bonding, P–C multiple bonding, and, for the Latypov optimization, the three-membered phosphirane ring, are examples of functionals that clearly do not give a fit to experimental chemical shifts due to serendipitous cancelling of errors, but rather must have some fundamental flaw for those structural types. Reports of comparisons of functionals do not describe such failures [7,8,107], so the observation here of a closer fit of calculated to experimental chemical shifts for most compounds using the M06-2X functional for the NMR calculation, but with major significant failures for some structural types, is unique and so must be taken into account when looking at novel structures.
Overall these scaling methods were shown to provide excellent support for confirmation of stereochemistry and of solution structures of unusual phosphorus compounds, and should be considered part of standard practice for DFT calculation of 31P NMR chemical shifts of novel compounds and those with unknown stereochemistry. Future work, however, should focus on the outlier compounds described here, whose unusual bonding gives rise to increased sensitivity to chemical shift calculations, and may help to more rapidly uncover which functionals are best for both geometry optimization and NMR chemical shift calculation.
Computational and NMR Details
For the trivalent phosphorus compounds, NMR chemical shifts (referenced to external 85% H3PO4 at 0.00 ppm, positive values downfield) were measured in CDCl3 on a 400 MHz Bruker spectrometer for PPh3 (−5.28 ppm), P(OMe)3 (141.41 ppm), and PCl3 (219.79 ppm) or were taken from the literature: PH3 (−238 ppm, liquid sample at −90 °C [44] and at room temperature in CCl4 [52]), PMeH2 (−163.5 ppm, liquid sample [44]), PMe2H (−98.5 ppm, liquid sample [44]), PMe3 (−61.58 ppm in CDCl3 [50]), MeOP(OCH2CH2O) (133.3 ppm, in CDCl3 [108]). For PCl3 the experimental geometry was used for the NMR calculations (P–Cl = 2.043 Å, ![[Graphic 1]](/bjoc/content/inline/1860-5397-19-4-i5.svg?max-width=637&scale=1.18182) (ClPCl) = 100.1°) [56] rather than the DFT optimized geometries (B3LYP: P–Cl = 2.096 Å,
(ClPCl) = 100.1°) [56] rather than the DFT optimized geometries (B3LYP: P–Cl = 2.096 Å, ![[Graphic 2]](/bjoc/content/inline/1860-5397-19-4-i6.svg?max-width=637&scale=1.18182) (ClPCl) = 100.9°; M06-2X: P–Cl = 2.069 Å,
(ClPCl) = 100.9°; M06-2X: P–Cl = 2.069 Å, ![[Graphic 3]](/bjoc/content/inline/1860-5397-19-4-i7.svg?max-width=637&scale=1.18182) (ClPCl) = 100.0°; PBE0: P–Cl = 2.070 Å,
(ClPCl) = 100.0°; PBE0: P–Cl = 2.070 Å, ![[Graphic 4]](/bjoc/content/inline/1860-5397-19-4-i8.svg?max-width=637&scale=1.18182) (ClPCl) = 100.7°; PBE0/6-31+G(d)/gas phase: P–Cl = 2.066 Å,
(ClPCl) = 100.7°; PBE0/6-31+G(d)/gas phase: P–Cl = 2.066 Å, ![[Graphic 5]](/bjoc/content/inline/1860-5397-19-4-i9.svg?max-width=637&scale=1.18182) (ClPCl) = 101.0°).
(ClPCl) = 101.0°).
For the tetracoordinate phosphorus compounds, NMR chemical shifts (referenced to external 85% H3PO4 at 0.00 ppm, positive values downfield) were measured in CDCl3 on a 400 MHz Bruker spectrometer for (iPrO)2P(O)H (4.54 ppm), Ph4P+ Br− (23.17 ppm), and (iPrO)2P(O)Me (28.61 ppm) or were taken from the literature: PH4+ BF4− (−105.3 ppm in CH3OH/CH3OD solution [109,110]), (PhO)4P+ PF6− (−28.0 ppm in CH3CN solution [111]), O=P(OCH2)3P=O (−18.1 ppm in DMSO solution [112]), O=P(OCH2)3P=O (6.4 ppm in DMSO solution [112]), (MeO)4P+ BF4− (1.9 ppm in CH2Cl2 solution [113]), (MeO)2P(O)H (11.3 ppm, liquid sample [45]), Me4P+ Br− (25.1 ppm in DMSO solution [114]), Ph3P=O (29.10 ppm in CDCl3 solution [115]), (MeO)2P(O)Me (32.3 ppm, liquid sample [116]), Me3P=O (38.79 ppm in CDCl3 solution [115]), EtOP(O)Me2 (50.3 ppm, liquid sample [43]).
Chemical shifts for the phosphonium salts R4P+ (R = MeO, Me, Ph) require comment. In the case of (MeO)4P+ BF4−, initial reports gave the 31P NMR chemical shift as 51.5 ppm [117,118], while all of our initial calculations placed it near −3 ppm. Subsequent work found the chemical shift to be 1.9 ppm [113], in agreement with our calculated shift, and no explanation for the original report has been offered [113]. For both of the R4P+ (R = Me, Ph) salts, chemical shift data were readily available for the Br− but not the Cl− salts. Bromine is not included in the IGLO-III and pcS-2 basis sets, however, so in those cases the calculated chloride salt chemical shifts were substituted. For Me4P+, the other basis sets gave identical chemical shifts for the Cl− and Br− salts, but for the Ph4P+ salts the Br− salts were on average 2.7(0.2) ppm upfield of the Cl− salts; if this correction were made, the deviations for the IGLO-III and pcS-2 basis sets would have been further reduced. Given the small difference and the absence of a strong justification for the correction, the chloride calculations were used without change.
Calculations were carried out using Gaussian 09, Revision D.01 [55]. The IGLO-III and pcS-2 basis sets were taken from the Basis Set Exchange [70], and all other basis sets were taken from Gaussian. X-ray structure coordinates were used as a starting point for optimizations when available. Energy optimizations were all accompanied by vibrational frequency calculations to ensure that stationary points were minima (all vibrations positive), and to ensure that true stationary points were confirmed in the vibrational frequency calculation. For the relatively large molecules, it was often found that the best results (in particular convergence to a minimum) were obtained using the “nosymm” instruction, and an initial calculation of all force constants (“calcfc”), rather than using the tight convergence criterion. All optimizations for the tri- and tetracoordinate phosphorus compounds utilized the 6-31G+(d,p) basis set with the polarizable continuum model, IEF-PCM/CHCl3, except for the Latypov calculations, which used the 6-31+G(d) basis set and no solvation [37]. NMR calculations (GIAO) were then carried out on these optimized structures using the same solvation method (IEF-PCM/CHCl3) or for the Latypov calculations, with no solvation. The reference calculations on H3PO4 were carried out the same way, using water solvation, again except for the Latypov calculations where no solvation was included. For compounds 1a–34[O] the same solvent used for the experimental NMR spectrum was used for each optimization and NMR calculation, again except for the Latypov calculation where no solvent was used. Keywords to run M06-2X calculations were m062x and integral=ultrafine, and for PBE0 pbe1pbe. For compounds where multiple optimized minima were found, energies were taken from the vibrational calculation (sum of electronic and thermal free energies) and used to calculate the relative amount of each conformation present at 298.15 K or at the temperature of the literature NMR when available [59], and the energy-weighted NMR chemical shifts were then computed. Coordinates and GaussView 6 images for all optimized structures including conformational minima may be found in Tables S18–S26 in Supporting Information File 1.
For Table 4, isotropic absolute magnetic shielding values were calculated for isomer A of 1a and 32 (both of which were about 90% of the total, and isomer B did not differ significantly for both) and for 8 for each method. In order to scale these isotropic values, the absolute shieldings were calculated in each case for the two most distant points in the trivalent scaling plots corresponding to Figure 2, namely, PH3 (liquid phase) and PCl3 (experimental geometry), and these two points were then used (Equation 4, which does not require the reference H3PO4) to scale the test compound values. Comparison of the values for the first four entries in Table 4 to those in Table 2 and Table 3 shows the agreement is acceptable. In order to compare each method, the MAD for each was determined using only the problematical chemical shifts for 1a (that is, C=PB) and 8 (dicoordinate PB) as well as that for 32, but PA for 1a was also listed for each.
Supporting Information
| Supporting Information File 1: Tables of calculated absolute isotropic chemical shifts, isomer ratios, unscaled chemical shifts, linear regressions, scaled chemical shifts and deviations, and coordinates of DFT optimized structures used for NMR calculations. | ||
| Format: PDF | Size: 52.2 MB | Download |
| Supporting Information File 2: Tables S1–S17 in editable format. | ||
| Format: XLSX | Size: 92.7 KB | Download |
References
-
Jain, R.; Bally, T.; Rablen, P. R. J. Org. Chem. 2009, 74, 4017–4023. doi:10.1021/jo900482q
Return to citation in text: [1] [2] -
Bally, T.; Rablen, P. R. J. Org. Chem. 2011, 76, 4818–4830. doi:10.1021/jo200513q
Return to citation in text: [1] [2] -
Lodewyk, M. W.; Siebert, M. R.; Tantillo, D. J. Chem. Rev. 2012, 112, 1839–1862. doi:10.1021/cr200106v
Return to citation in text: [1] [2] [3] [4] [5] [6] [7] -
Grimblat, N.; Sarotti, A. M. Chem. – Eur. J. 2016, 22, 12246–12261. doi:10.1002/chem.201601150
Return to citation in text: [1] -
Navarro‐Vázquez, A. Magn. Reson. Chem. 2017, 55, 29–32. doi:10.1002/mrc.4502
Return to citation in text: [1] -
Xin, D.; Sader, C. A.; Chaudhary, O.; Jones, P.-J.; Wagner, K.; Tautermann, C. S.; Yang, Z.; Busacca, C. A.; Saraceno, R. A.; Fandrick, K. R.; Gonnella, N. C.; Horspool, K.; Hansen, G.; Senanayake, C. H. J. Org. Chem. 2017, 82, 5135–5145. doi:10.1021/acs.joc.7b00321
Return to citation in text: [1] -
Iron, M. A. J. Chem. Theory Comput. 2017, 13, 5798–5819. doi:10.1021/acs.jctc.7b00772
Return to citation in text: [1] [2] [3] [4] -
Jensen, F. J. Chem. Theory Comput. 2018, 14, 4651–4661. doi:10.1021/acs.jctc.8b00477
Return to citation in text: [1] [2] [3] [4] [5] [6] [7] [8] -
Bifulco, G.; Dambruoso, P.; Gomez-Paloma, L.; Riccio, R. Chem. Rev. 2007, 107, 3744–3779. doi:10.1021/cr030733c
Return to citation in text: [1] -
Saielli, G.; Nicolaou, K. C.; Ortiz, A.; Zhang, H.; Bagno, A. J. Am. Chem. Soc. 2011, 133, 6072–6077. doi:10.1021/ja201108a
Return to citation in text: [1] -
Tantillo, D. J. Nat. Prod. Rep. 2013, 30, 1079–1086. doi:10.1039/c3np70028c
Return to citation in text: [1] -
Marell, D. J.; Emond, S. J.; Kulshrestha, A.; Hoye, T. R. J. Org. Chem. 2014, 79, 752–758. doi:10.1021/jo402627s
Return to citation in text: [1] -
Brown, S. G.; Jansma, M. J.; Hoye, T. R. J. Nat. Prod. 2012, 75, 1326–1331. doi:10.1021/np300248w
Return to citation in text: [1] -
Rablen, P. R.; Pearlman, S. A.; Finkbiner, J. J. Phys. Chem. A 1999, 103, 7357–7363. doi:10.1021/jp9916889
Return to citation in text: [1] -
Lodewyk, M. W.; Siebert, M. R.; Tantillo, D. J.; Rablen, P. R.; Bally, T. CHESHIRE CCAT- CHEmical SHIft REpository with Coupling Constants Added To. http://cheshirenmr.info (accessed Sept 27, 2022).
Return to citation in text: [1] [2] [3] [4] [5] [6] -
Tong, J.; Liu, S.; Zhang, S.; Li, S. Z. Spectrochim. Acta, Part A 2007, 67A, 837–846. doi:10.1016/j.saa.2006.08.041
Return to citation in text: [1] -
Dransfeld, A.; Ragué Schleyer, P. v. Magn. Reson. Chem. 1998, 36 (Suppl. 1), S29–S43. doi:10.1002/(sici)1097-458x(199806)36:13<s29::aid-omr288>3.0.co;2-t
Return to citation in text: [1] -
van Wüllen, C. Phys. Chem. Chem. Phys. 2000, 2, 2137–2144. doi:10.1039/b000461h
Return to citation in text: [1] [2] [3] [4] [5] [6] [7] [8] -
Patchkovskii, S.; Ziegler, T. J. Phys. Chem. A 2002, 106, 1088–1099. doi:10.1021/jp014184v
Return to citation in text: [1] [2] -
Rezaei-Sameti, M. J. Mol. Struct.: THEOCHEM 2008, 867, 122–124. doi:10.1016/j.theochem.2008.07.016
Return to citation in text: [1] [2] -
Chernyshev, K. A.; Krivdin, L. B. Russ. J. Org. Chem. 2010, 46, 785–790. doi:10.1134/s1070428010060023
Return to citation in text: [1] [2] [3] [4] [5] [6] [7] [8] -
Tafazzoli, M.; Ebrahimi, H. P. Phosphorus, Sulfur Silicon Relat. Elem. 2011, 186, 1491–1500. doi:10.1080/10426507.2010.520141
Return to citation in text: [1] [2] -
Maryasin, B.; Zipse, H. Phys. Chem. Chem. Phys. 2011, 13, 5150–5158. doi:10.1039/c0cp02653k
Return to citation in text: [1] [2] -
Fedorov, S. V.; Rusakov, Y. Y.; Krivdin, L. B. Magn. Reson. Chem. 2014, 52, 699–710. doi:10.1002/mrc.4122
Return to citation in text: [1] [2] [3] [4] [5] [6] [7] [8] [9] [10] -
Fleischer, U.; Schindler, M.; Kutzelnigg, W. J. Chem. Phys. 1987, 86, 6337–6347. doi:10.1063/1.452419
Return to citation in text: [1] [2] -
Kutzelnigg, W.; Fleischer, U.; Schindler, M. The IGLO-Method: Ab-initio Calculation and Interpretation of NMR Chemical Shifts and Magnetic Susceptibilities. In NMR Basic Principles and Progress; Diehl, P.; Fluck, E.; Günther, H.; Cosfeld, R.; Seelig, J., Eds.; Springer-Verlag: Berlin, 1990; Vol. 23, pp 165–262. doi:10.1007/978-3-642-75932-1_3
Return to citation in text: [1] [2] [3] -
Jensen, F. J. Chem. Theory Comput. 2008, 4, 719–727. doi:10.1021/ct800013z
Return to citation in text: [1] [2] [3] -
Jensen, F. J. Chem. Theory Comput. 2014, 10, 1074–1085. doi:10.1021/ct401026a
Return to citation in text: [1] [2] [3] -
Přecechtělová, J.; Novák, P.; Munzarová, M. L.; Kaupp, M.; Sklenář, V. J. Am. Chem. Soc. 2010, 132, 17139–17148. doi:10.1021/ja104564g
Return to citation in text: [1] [2] -
Přecechtělová, J.; Munzarová, M. L.; Vaara, J.; Novotný, J.; Dračínský, M.; Sklenář, V. J. Chem. Theory Comput. 2013, 9, 1641–1656. doi:10.1021/ct300488y
Return to citation in text: [1] [2] -
Fukal, J.; Páv, O.; Buděšínský, M.; Šebera, J.; Sychrovský, V. Phys. Chem. Chem. Phys. 2017, 19, 31830–31841. doi:10.1039/c7cp06969c
Return to citation in text: [1] -
Fukal, J.; Páv, O.; Buděšínský, M.; Rosenberg, I.; Šebera, J.; Sychrovský, V. Phys. Chem. Chem. Phys. 2019, 21, 9924–9934. doi:10.1039/c9cp01460h
Return to citation in text: [1] -
Pascual-Borràs, M.; López, X.; Poblet, J. M. Phys. Chem. Chem. Phys. 2015, 17, 8723–8731. doi:10.1039/c4cp05016a
Return to citation in text: [1] [2] -
Payard, P.-A.; Perego, L. A.; Grimaud, L.; Ciofini, I. Organometallics 2020, 39, 3121–3130. doi:10.1021/acs.organomet.0c00309
Return to citation in text: [1] -
Kondrashova, S. A.; Polyancev, F. M.; Latypov, S. K. Molecules 2022, 27, 2668. doi:10.3390/molecules27092668
Return to citation in text: [1] -
Chesnut, D. B. Chem. Phys. Lett. 2003, 380, 251–257. doi:10.1016/j.cplett.2003.08.104
Return to citation in text: [1] [2] [3] -
Latypov, S. K.; Polyancev, F. M.; Yakhvarov, D. G.; Sinyashin, O. G. Phys. Chem. Chem. Phys. 2015, 17, 6976–6987. doi:10.1039/c5cp00240k
Return to citation in text: [1] [2] [3] [4] [5] [6] [7] [8] [9] [10] [11] [12] [13] [14] [15] [16] [17] [18] [19] -
Kwan, E. E.; Liu, R. Y. J. Chem. Theory Comput. 2015, 11, 5083–5089. doi:10.1021/acs.jctc.5b00856
Return to citation in text: [1] -
Keal, T. W.; Tozer, D. J. J. Chem. Phys. 2003, 119, 3015–3024. doi:10.1063/1.1590634
Return to citation in text: [1] -
Sarotti, A. M.; Pellegrinet, S. C. J. Org. Chem. 2009, 74, 7254–7260. doi:10.1021/jo901234h
Return to citation in text: [1] [2] -
Adamo, C.; Barone, V. J. Chem. Phys. 1999, 110, 6158–6170. doi:10.1063/1.478522
Return to citation in text: [1] -
Krivdin, L. B. Magn. Reson. Chem. 2020, 58, 478–499. doi:10.1002/mrc.4965
Return to citation in text: [1] -
Muller, N.; Lauterbur, P. C.; Goldenson, J. J. Am. Chem. Soc. 1956, 78, 3557–3561. doi:10.1021/ja01596a002
Return to citation in text: [1] [2] [3] [4] -
Van Wazer, J. R.; Callis, C. F.; Shoolery, J. N.; Jones, R. C. J. Am. Chem. Soc. 1956, 78, 5715–5726. doi:10.1021/ja01603a002
Return to citation in text: [1] [2] [3] [4] [5] [6] [7] [8] -
Jones, R. A. Y.; Katritzky, A. R. Angew. Chem., Int. Ed. Engl. 1962, 1, 32–41. doi:10.1002/anie.196200321
Return to citation in text: [1] [2] -
Mark, V.; Dungan, C. H.; Crutchfield, M. M.; van Wazer, J. R. Top. Phosphorus Chem. 1967, 5, 227–457.
Return to citation in text: [1] -
Tebby, J. C. CRC Handbook of Phosphorus-31 Nuclear Magnetic Resonance Data; CRC Press: Boca Raton, FL, 1991.
Return to citation in text: [1] -
Quin, L. D.; Verkade, J. G., Eds. Phosphorus-31 NMR Spectral Properties in Compound Characterization and Structural Analysis; Wiley: New York, NY, USA, 1994.
Return to citation in text: [1] -
Nielsen, M. L.; Pustinger, J. V.; Strobel, J. J. Chem. Eng. Data 1964, 9, 167–170. doi:10.1021/je60021a003
Return to citation in text: [1] -
Alajarín, M.; Molina, P.; Vidal, A.; Tovar, F. Tetrahedron 1997, 53, 13449–13472. doi:10.1016/s0040-4020(97)00855-7
Return to citation in text: [1] [2] -
Chesnut, D. B. J. Phys. Chem. A 2005, 109, 11962–11966. doi:10.1021/jp0555910
Return to citation in text: [1] [2] [3] -
Zumbulyadis, N.; Dailey, B. P. Mol. Phys. 1974, 27, 633–640. doi:10.1080/00268977400100551
Return to citation in text: [1] [2] [3] -
Lantto, P.; Jackowski, K.; Makulski, W.; Olejniczak, M.; Jaszuński, M. J. Phys. Chem. A 2011, 115, 10617–10623. doi:10.1021/jp2052739
Return to citation in text: [1] [2] -
Jameson, C. J.; De Dios, A.; Keith Jameson, A. Chem. Phys. Lett. 1990, 167, 575–582. doi:10.1016/0009-2614(90)85472-o
Return to citation in text: [1] -
Gaussian 09, Revision D.01; Gaussian, Inc.: Wallingford, CT, 2013.
Return to citation in text: [1] [2] -
Harmony, M. D.; Laurie, V. W.; Kuczkowski, R. L.; Schwendeman, R. H.; Ramsay, D. A.; Lovas, F. J.; Lafferty, W. J.; Maki, A. G. J. Phys. Chem. Ref. Data 1979, 8, 619–721. doi:10.1063/1.555605
Return to citation in text: [1] [2] -
Zhao, Y.; Truhlar, D. G. Acc. Chem. Res. 2008, 41, 157–167. doi:10.1021/ar700111a
Return to citation in text: [1] [2] -
Alipour, M. Theor. Chem. Acc. 2018, 137, No. 8. doi:10.1007/s00214-017-2182-z
Return to citation in text: [1] -
Junkes, P.; Baudler, M.; Dobbers, J.; Rackwitz, D. Z. Naturforsch., B: Anorg. Chem., Org. Chem., Biochem., Biophys., Biol. 1972, 27, 1451–1456. doi:10.1515/znb-1972-1204
Return to citation in text: [1] [2] -
Althoff, W.; Fild, M.; Rieck, H.-P.; Schmutzler, R. Chem. Ber. 1978, 111, 1845–1856. doi:10.1002/cber.19781110519
Return to citation in text: [1] -
Steinbach, J.; Binger, P.; Regitz, M. Synthesis 2003, 2720–2724. doi:10.1055/s-2003-42452
Return to citation in text: [1] [2] -
Hellwinkel, D.; Wilfinger, H. J. Phosphorus Relat. Group V Elem. 1976, 6, 151–159.
Return to citation in text: [1] -
Richman, J. E.; Atkins, T. J. Tetrahedron Lett. 1978, 19, 4333–4336. doi:10.1016/s0040-4039(01)95217-7
Return to citation in text: [1] -
Çiftçi, G. Y.; Eçik, E. T.; Yıldırım, T.; Bilgin, K.; Şenkuytu, E.; Yuksel, F.; Uludağ, Y.; Kılıç, A. Tetrahedron 2013, 69, 1454–1461. doi:10.1016/j.tet.2012.12.027
Return to citation in text: [1] -
Quin, L. D.; Mesch, K. A.; Orton, W. L. Phosphorus Sulfur Relat. Elem. 1982, 12, 161–177. doi:10.1080/03086648208077444
Return to citation in text: [1] -
Yoshifuji, M.; Hirano, Y.; Schnakenburg, G.; Streubel, R.; Niecke, E.; Ito, S. Helv. Chim. Acta 2012, 95, 1723–1729. doi:10.1002/hlca.201200442
Return to citation in text: [1] -
Surgenor, B. A.; Bühl, M.; Slawin, A. M. Z.; Woollins, J. D.; Kilian, P. Angew. Chem., Int. Ed. 2012, 51, 10150–10153. doi:10.1002/anie.201204998
Return to citation in text: [1] [2] -
Zagidullin, A.; Ganushevich, Y.; Miluykov, V.; Krivolapov, D.; Kataeva, O.; Sinyashin, O.; Hey-Hawkins, E. Org. Biomol. Chem. 2012, 10, 5298–5306. doi:10.1039/c2ob25532d
Return to citation in text: [1] -
Miluykov, V.; Bezkishko, I.; Zagidullin, A.; Sinyashin, O.; Lönnecke, P.; Hey-Hawkins, E. Eur. J. Org. Chem. 2009, 1269–1274. doi:10.1002/ejoc.200801181
Return to citation in text: [1] -
Pritchard, B. P.; Altarawy, D.; Didier, B.; Gibson, T. D.; Windus, T. L. J. Chem. Inf. Model. 2019, 59, 4814–4820. doi:10.1021/acs.jcim.9b00725
Return to citation in text: [1] [2] -
Alcaraz, J.-M.; Mathey, F. Tetrahedron Lett. 1984, 25, 4659–4662. doi:10.1016/s0040-4039(01)91226-2
Return to citation in text: [1] [2] [3] -
Hersh, W. H.; Lam, S. T.; Moskovic, D. J.; Panagiotakis, A. J. J. Org. Chem. 2012, 77, 4968–4979. doi:10.1021/jo3003776
Return to citation in text: [1] -
Tichotová, M.; Ešnerová, A.; Tučková, L.; Bednárová, L.; Císařová, I.; Baszczyňski, O.; Procházková, E. J. Magn. Reson. 2022, 336, 107149. doi:10.1016/j.jmr.2022.107149
Return to citation in text: [1] -
Huang, Y.; Yu, J.; Bentrude, W. G. J. Org. Chem. 1995, 60, 4767–4773. doi:10.1021/jo00120a020
Return to citation in text: [1] [2] [3] [4] [5] -
Brown, J. M.; Carey, J. V.; Russell, M. J. H. Tetrahedron 1990, 46, 4877–4886. doi:10.1016/s0040-4020(01)85600-3
Return to citation in text: [1] [2] -
Hersh, W. H.; Xu, P.; Simpson, C. K.; Grob, J.; Bickford, B.; Hamdani, M. S.; Wood, T.; Rheingold, A. L. J. Org. Chem. 2004, 69, 2153–2163. doi:10.1021/jo035508+
Return to citation in text: [1] [2] -
Solovieva, S. E.; Gruner, M.; Antipin, I. S.; Habicher, W. D.; Konovalov, A. I. Org. Lett. 2001, 3, 1299–1301. doi:10.1021/ol015658b
Return to citation in text: [1] [2] [3] [4] -
Tay, M. Q. Y.; Lu, Y.; Ganguly, R.; Vidović, D. Angew. Chem., Int. Ed. 2013, 52, 3132–3135. doi:10.1002/anie.201209223
Return to citation in text: [1] -
Đorđević, N.; Ganguly, R.; Petković, M.; Vidović, D. Chem. Commun. 2016, 52, 9789–9792. doi:10.1039/c6cc04161b
Return to citation in text: [1] -
Lemp, O.; Balmer, M.; Reiter, K.; Weigend, F.; von Hänisch, C. Chem. Commun. 2017, 53, 7620–7623. doi:10.1039/c7cc04422d
Return to citation in text: [1] [2] [3] -
Hersh, W. H. Beilstein J. Org. Chem. 2015, 11, 184–191. doi:10.3762/bjoc.11.19
Return to citation in text: [1] [2] -
Setzer, W. N.; Black, B. G.; Hovanes, B. A.; Hubbard, J. L. J. Org. Chem. 1989, 54, 1709–1713. doi:10.1021/jo00268a038
Return to citation in text: [1] [2] -
Nykaza, T. V.; Ramirez, A.; Harrison, T. S.; Luzung, M. R.; Radosevich, A. T. J. Am. Chem. Soc. 2018, 140, 3103–3113. doi:10.1021/jacs.7b13803
Return to citation in text: [1] [2] [3] [4] [5] [6] [7] -
Cowley, A. H.; Kemp, R. A. Chem. Rev. 1985, 85, 367–382. doi:10.1021/cr00069a002
Return to citation in text: [1] -
Spinney, H. A.; Yap, G. P. A.; Korobkov, I.; DiLabio, G.; Richeson, D. S. Organometallics 2006, 25, 3541–3543. doi:10.1021/om060466b
Return to citation in text: [1] -
Reiß, F.; Schulz, A.; Villinger, A. Eur. J. Inorg. Chem. 2012, 261–271. doi:10.1002/ejic.201100978
Return to citation in text: [1] -
Katz, T. J.; Nicholson, C. R.; Reilly, C. A. J. Am. Chem. Soc. 1966, 88, 3832–3842. doi:10.1021/ja00968a029
Return to citation in text: [1] [2] -
Bulo, R. E.; Jansen, H.; Ehlers, A. W.; de Kanter, F. J. J.; Schakel, M.; Lutz, M.; Spek, A. L.; Lammertsma, K. Angew. Chem., Int. Ed. 2004, 43, 714–717. doi:10.1002/anie.200351855
Return to citation in text: [1] -
Bulo, R. E.; Jansen, H.; Ehlers, A. W.; de Kanter, F. J. J.; Schakel, M.; Lutz, M.; Spek, A. L.; Lammertsma, K. Angew. Chem., Int. Ed. 2004, 43, 3748a–3748. doi:10.1002/anie.200490098
Return to citation in text: [1] -
Mardirossian, N.; Head-Gordon, M. J. Chem. Theory Comput. 2016, 12, 4303–4325. doi:10.1021/acs.jctc.6b00637
Return to citation in text: [1] [2] [3] [4] -
Mardirossian, N.; Head-Gordon, M. Mol. Phys. 2017, 115, 2315–2372. doi:10.1080/00268976.2017.1333644
Return to citation in text: [1] [2] -
Tao, J.; Perdew, J. P.; Staroverov, V. N.; Scuseria, G. E. Phys. Rev. Lett. 2003, 91, 146401. doi:10.1103/physrevlett.91.146401
Return to citation in text: [1] [2] -
Perdew, J. P.; Ruzsinszky, A.; Tao, J.; Staroverov, V. N.; Scuseria, G. E.; Csonka, G. I. J. Chem. Phys. 2005, 123, 062201. doi:10.1063/1.1904565
Return to citation in text: [1] -
Su, N. Q.; Zhu, Z.; Xu, X. Proc. Natl. Acad. Sci. U. S. A. 2018, 115, 2287–2292. doi:10.1073/pnas.1713047115
Return to citation in text: [1] -
Zhang, I. Y.; Xu, X. Wiley Interdiscip. Rev.: Comput. Mol. Sci. 2021, 11, e1490. doi:10.1002/wcms.1490
Return to citation in text: [1] -
Chai, J.-D.; Head-Gordon, M. Phys. Chem. Chem. Phys. 2008, 10, 6615–6620. doi:10.1039/b810189b
Return to citation in text: [1] [2] -
Grimme, S.; Antony, J.; Ehrlich, S.; Krieg, H. J. Chem. Phys. 2010, 132, 154104. doi:10.1063/1.3382344
Return to citation in text: [1] [2] [3] -
Modrzejewski, M.; Hapka, M.; Chalasinski, G.; Szczesniak, M. M. J. Chem. Theory Comput. 2016, 12, 3662–3673. doi:10.1021/acs.jctc.6b00406
Return to citation in text: [1] [2] [3] [4] -
Staroverov, V. N.; Scuseria, G. E.; Tao, J.; Perdew, J. P. J. Chem. Phys. 2003, 119, 12129–12137. doi:10.1063/1.1626543
Return to citation in text: [1] -
Staroverov, V. N.; Scuseria, G. E.; Tao, J.; Perdew, J. P. J. Chem. Phys. 2004, 121, 11507. doi:10.1063/1.1795692
Return to citation in text: [1] -
Hohenstein, E. G.; Chill, S. T.; Sherrill, C. D. J. Chem. Theory Comput. 2008, 4, 1996–2000. doi:10.1021/ct800308k
Return to citation in text: [1] -
Zhao, Y.; Truhlar, D. G. J. Chem. Phys. 2006, 125, 194101. doi:10.1063/1.2370993
Return to citation in text: [1] -
Shenderovich, I. G. Chem.: Methods 2021, 1, 61–70. doi:10.1002/cmtd.202000033
Return to citation in text: [1] -
Peverati, R.; Truhlar, D. G. J. Phys. Chem. Lett. 2012, 3, 117–124. doi:10.1021/jz201525m
Return to citation in text: [1] -
Peverati, R.; Truhlar, D. G. J. Phys. Chem. Lett. 2011, 2, 2810–2817. doi:10.1021/jz201170d
Return to citation in text: [1] -
Peverati, R.; Truhlar, D. G. Phys. Chem. Chem. Phys. 2012, 14, 16187–16191. doi:10.1039/c2cp42576a
Return to citation in text: [1] -
Laskowski, R.; Blaha, P.; Tran, F. Phys. Rev. B 2013, 87, 195130. doi:10.1103/physrevb.87.195130
Return to citation in text: [1] -
Besserre, D.; Coffi-Nketsia, S. Org. Magn. Reson. 1980, 13, 313–318. doi:10.1002/mrc.1270130502
Return to citation in text: [1] -
Sheldrick, G. M. Trans. Faraday Soc. 1967, 63, 1077–1082. doi:10.1039/tf9676301077
Return to citation in text: [1] -
Wasylishen, R. E.; Burford, N. Can. J. Chem. 1987, 65, 2707–2712. doi:10.1139/v87-449
Return to citation in text: [1] -
Peake, S. C.; Fild, M.; Hewson, M. J. C.; Schmutzler, R. Inorg. Chem. 1971, 10, 2723–2727. doi:10.1021/ic50106a020
Return to citation in text: [1] -
Coskran, K. J.; Verkade, J. G. Inorg. Chem. 1965, 4, 1655–1657. doi:10.1021/ic50033a026
Return to citation in text: [1] [2] -
Finley, J. H.; Denney, D. Z.; Denney, D. B. J. Am. Chem. Soc. 1969, 91, 5826–5831. doi:10.1021/ja01049a021
Return to citation in text: [1] [2] [3] -
Grim, S. O.; McFarlane, W.; Davidoff, E. F.; Marks, T. J. J. Phys. Chem. 1966, 70, 581–584. doi:10.1021/j100874a502
Return to citation in text: [1] -
Hilliard, C. R.; Bhuvanesh, N.; Gladysz, J. A.; Blümel, J. Dalton Trans. 2012, 41, 1742–1754. doi:10.1039/c1dt11863c
Return to citation in text: [1] [2] -
Moedritzer, K.; Maier, L.; Groenweghe, L. C. D. J. Chem. Eng. Data 1962, 7, 307–310. doi:10.1021/je60013a043
Return to citation in text: [1] -
Cohen, J. S. Tetrahedron Lett. 1965, 6, 3491–3496. doi:10.1016/s0040-4039(01)89332-1
Return to citation in text: [1] -
Cohen, J. S. J. Am. Chem. Soc. 1967, 89, 2543–2547. doi:10.1021/ja00987a008
Return to citation in text: [1]
| 37. | Latypov, S. K.; Polyancev, F. M.; Yakhvarov, D. G.; Sinyashin, O. G. Phys. Chem. Chem. Phys. 2015, 17, 6976–6987. doi:10.1039/c5cp00240k |
| 60. | Althoff, W.; Fild, M.; Rieck, H.-P.; Schmutzler, R. Chem. Ber. 1978, 111, 1845–1856. doi:10.1002/cber.19781110519 |
| 37. | Latypov, S. K.; Polyancev, F. M.; Yakhvarov, D. G.; Sinyashin, O. G. Phys. Chem. Chem. Phys. 2015, 17, 6976–6987. doi:10.1039/c5cp00240k |
| 59. | Junkes, P.; Baudler, M.; Dobbers, J.; Rackwitz, D. Z. Naturforsch., B: Anorg. Chem., Org. Chem., Biochem., Biophys., Biol. 1972, 27, 1451–1456. doi:10.1515/znb-1972-1204 |
| 70. | Pritchard, B. P.; Altarawy, D.; Didier, B.; Gibson, T. D.; Windus, T. L. J. Chem. Inf. Model. 2019, 59, 4814–4820. doi:10.1021/acs.jcim.9b00725 |
| 24. | Fedorov, S. V.; Rusakov, Y. Y.; Krivdin, L. B. Magn. Reson. Chem. 2014, 52, 699–710. doi:10.1002/mrc.4122 |
| 117. | Cohen, J. S. Tetrahedron Lett. 1965, 6, 3491–3496. doi:10.1016/s0040-4039(01)89332-1 |
| 118. | Cohen, J. S. J. Am. Chem. Soc. 1967, 89, 2543–2547. doi:10.1021/ja00987a008 |
| 43. | Muller, N.; Lauterbur, P. C.; Goldenson, J. J. Am. Chem. Soc. 1956, 78, 3557–3561. doi:10.1021/ja01596a002 |
| 61. | Steinbach, J.; Binger, P.; Regitz, M. Synthesis 2003, 2720–2724. doi:10.1055/s-2003-42452 |
| 113. | Finley, J. H.; Denney, D. Z.; Denney, D. B. J. Am. Chem. Soc. 1969, 91, 5826–5831. doi:10.1021/ja01049a021 |
| 113. | Finley, J. H.; Denney, D. Z.; Denney, D. B. J. Am. Chem. Soc. 1969, 91, 5826–5831. doi:10.1021/ja01049a021 |
| 61. | Steinbach, J.; Binger, P.; Regitz, M. Synthesis 2003, 2720–2724. doi:10.1055/s-2003-42452 |
| 115. | Hilliard, C. R.; Bhuvanesh, N.; Gladysz, J. A.; Blümel, J. Dalton Trans. 2012, 41, 1742–1754. doi:10.1039/c1dt11863c |
| 37. | Latypov, S. K.; Polyancev, F. M.; Yakhvarov, D. G.; Sinyashin, O. G. Phys. Chem. Chem. Phys. 2015, 17, 6976–6987. doi:10.1039/c5cp00240k |
| 114. | Grim, S. O.; McFarlane, W.; Davidoff, E. F.; Marks, T. J. J. Phys. Chem. 1966, 70, 581–584. doi:10.1021/j100874a502 |
| 37. | Latypov, S. K.; Polyancev, F. M.; Yakhvarov, D. G.; Sinyashin, O. G. Phys. Chem. Chem. Phys. 2015, 17, 6976–6987. doi:10.1039/c5cp00240k |
| 115. | Hilliard, C. R.; Bhuvanesh, N.; Gladysz, J. A.; Blümel, J. Dalton Trans. 2012, 41, 1742–1754. doi:10.1039/c1dt11863c |
| 37. | Latypov, S. K.; Polyancev, F. M.; Yakhvarov, D. G.; Sinyashin, O. G. Phys. Chem. Chem. Phys. 2015, 17, 6976–6987. doi:10.1039/c5cp00240k |
| 116. | Moedritzer, K.; Maier, L.; Groenweghe, L. C. D. J. Chem. Eng. Data 1962, 7, 307–310. doi:10.1021/je60013a043 |
| 37. | Latypov, S. K.; Polyancev, F. M.; Yakhvarov, D. G.; Sinyashin, O. G. Phys. Chem. Chem. Phys. 2015, 17, 6976–6987. doi:10.1039/c5cp00240k |
| 65. | Quin, L. D.; Mesch, K. A.; Orton, W. L. Phosphorus Sulfur Relat. Elem. 1982, 12, 161–177. doi:10.1080/03086648208077444 |
| 77. | Solovieva, S. E.; Gruner, M.; Antipin, I. S.; Habicher, W. D.; Konovalov, A. I. Org. Lett. 2001, 3, 1299–1301. doi:10.1021/ol015658b |
| 66. | Yoshifuji, M.; Hirano, Y.; Schnakenburg, G.; Streubel, R.; Niecke, E.; Ito, S. Helv. Chim. Acta 2012, 95, 1723–1729. doi:10.1002/hlca.201200442 |
| 74. | Huang, Y.; Yu, J.; Bentrude, W. G. J. Org. Chem. 1995, 60, 4767–4773. doi:10.1021/jo00120a020 |
| 37. | Latypov, S. K.; Polyancev, F. M.; Yakhvarov, D. G.; Sinyashin, O. G. Phys. Chem. Chem. Phys. 2015, 17, 6976–6987. doi:10.1039/c5cp00240k |
| 78. | Tay, M. Q. Y.; Lu, Y.; Ganguly, R.; Vidović, D. Angew. Chem., Int. Ed. 2013, 52, 3132–3135. doi:10.1002/anie.201209223 |
| 64. | Çiftçi, G. Y.; Eçik, E. T.; Yıldırım, T.; Bilgin, K.; Şenkuytu, E.; Yuksel, F.; Uludağ, Y.; Kılıç, A. Tetrahedron 2013, 69, 1454–1461. doi:10.1016/j.tet.2012.12.027 |
| 77. | Solovieva, S. E.; Gruner, M.; Antipin, I. S.; Habicher, W. D.; Konovalov, A. I. Org. Lett. 2001, 3, 1299–1301. doi:10.1021/ol015658b |
| 62. | Hellwinkel, D.; Wilfinger, H. J. Phosphorus Relat. Group V Elem. 1976, 6, 151–159. |
| 74. | Huang, Y.; Yu, J.; Bentrude, W. G. J. Org. Chem. 1995, 60, 4767–4773. doi:10.1021/jo00120a020 |
| 63. | Richman, J. E.; Atkins, T. J. Tetrahedron Lett. 1978, 19, 4333–4336. doi:10.1016/s0040-4039(01)95217-7 |
| 76. | Hersh, W. H.; Xu, P.; Simpson, C. K.; Grob, J.; Bickford, B.; Hamdani, M. S.; Wood, T.; Rheingold, A. L. J. Org. Chem. 2004, 69, 2153–2163. doi:10.1021/jo035508+ |
| 74. | Huang, Y.; Yu, J.; Bentrude, W. G. J. Org. Chem. 1995, 60, 4767–4773. doi:10.1021/jo00120a020 |
| 74. | Huang, Y.; Yu, J.; Bentrude, W. G. J. Org. Chem. 1995, 60, 4767–4773. doi:10.1021/jo00120a020 |
| 76. | Hersh, W. H.; Xu, P.; Simpson, C. K.; Grob, J.; Bickford, B.; Hamdani, M. S.; Wood, T.; Rheingold, A. L. J. Org. Chem. 2004, 69, 2153–2163. doi:10.1021/jo035508+ |
| 69. | Miluykov, V.; Bezkishko, I.; Zagidullin, A.; Sinyashin, O.; Lönnecke, P.; Hey-Hawkins, E. Eur. J. Org. Chem. 2009, 1269–1274. doi:10.1002/ejoc.200801181 |
| 70. | Pritchard, B. P.; Altarawy, D.; Didier, B.; Gibson, T. D.; Windus, T. L. J. Chem. Inf. Model. 2019, 59, 4814–4820. doi:10.1021/acs.jcim.9b00725 |
| 59. | Junkes, P.; Baudler, M.; Dobbers, J.; Rackwitz, D. Z. Naturforsch., B: Anorg. Chem., Org. Chem., Biochem., Biophys., Biol. 1972, 27, 1451–1456. doi:10.1515/znb-1972-1204 |
| 67. | Surgenor, B. A.; Bühl, M.; Slawin, A. M. Z.; Woollins, J. D.; Kilian, P. Angew. Chem., Int. Ed. 2012, 51, 10150–10153. doi:10.1002/anie.201204998 |
| 68. | Zagidullin, A.; Ganushevich, Y.; Miluykov, V.; Krivolapov, D.; Kataeva, O.; Sinyashin, O.; Hey-Hawkins, E. Org. Biomol. Chem. 2012, 10, 5298–5306. doi:10.1039/c2ob25532d |
| 79. | Đorđević, N.; Ganguly, R.; Petković, M.; Vidović, D. Chem. Commun. 2016, 52, 9789–9792. doi:10.1039/c6cc04161b |
| 18. | van Wüllen, C. Phys. Chem. Chem. Phys. 2000, 2, 2137–2144. doi:10.1039/b000461h |
| 83. | Nykaza, T. V.; Ramirez, A.; Harrison, T. S.; Luzung, M. R.; Radosevich, A. T. J. Am. Chem. Soc. 2018, 140, 3103–3113. doi:10.1021/jacs.7b13803 |
| 56. | Harmony, M. D.; Laurie, V. W.; Kuczkowski, R. L.; Schwendeman, R. H.; Ramsay, D. A.; Lovas, F. J.; Lafferty, W. J.; Maki, A. G. J. Phys. Chem. Ref. Data 1979, 8, 619–721. doi:10.1063/1.555605 |
| 77. | Solovieva, S. E.; Gruner, M.; Antipin, I. S.; Habicher, W. D.; Konovalov, A. I. Org. Lett. 2001, 3, 1299–1301. doi:10.1021/ol015658b |
| 83. | Nykaza, T. V.; Ramirez, A.; Harrison, T. S.; Luzung, M. R.; Radosevich, A. T. J. Am. Chem. Soc. 2018, 140, 3103–3113. doi:10.1021/jacs.7b13803 |
| 3. | Lodewyk, M. W.; Siebert, M. R.; Tantillo, D. J. Chem. Rev. 2012, 112, 1839–1862. doi:10.1021/cr200106v |
| 83. | Nykaza, T. V.; Ramirez, A.; Harrison, T. S.; Luzung, M. R.; Radosevich, A. T. J. Am. Chem. Soc. 2018, 140, 3103–3113. doi:10.1021/jacs.7b13803 |
| 1. | Jain, R.; Bally, T.; Rablen, P. R. J. Org. Chem. 2009, 74, 4017–4023. doi:10.1021/jo900482q |
| 2. | Bally, T.; Rablen, P. R. J. Org. Chem. 2011, 76, 4818–4830. doi:10.1021/jo200513q |
| 3. | Lodewyk, M. W.; Siebert, M. R.; Tantillo, D. J. Chem. Rev. 2012, 112, 1839–1862. doi:10.1021/cr200106v |
| 4. | Grimblat, N.; Sarotti, A. M. Chem. – Eur. J. 2016, 22, 12246–12261. doi:10.1002/chem.201601150 |
| 5. | Navarro‐Vázquez, A. Magn. Reson. Chem. 2017, 55, 29–32. doi:10.1002/mrc.4502 |
| 6. | Xin, D.; Sader, C. A.; Chaudhary, O.; Jones, P.-J.; Wagner, K.; Tautermann, C. S.; Yang, Z.; Busacca, C. A.; Saraceno, R. A.; Fandrick, K. R.; Gonnella, N. C.; Horspool, K.; Hansen, G.; Senanayake, C. H. J. Org. Chem. 2017, 82, 5135–5145. doi:10.1021/acs.joc.7b00321 |
| 7. | Iron, M. A. J. Chem. Theory Comput. 2017, 13, 5798–5819. doi:10.1021/acs.jctc.7b00772 |
| 8. | Jensen, F. J. Chem. Theory Comput. 2018, 14, 4651–4661. doi:10.1021/acs.jctc.8b00477 |
| 71. | Alcaraz, J.-M.; Mathey, F. Tetrahedron Lett. 1984, 25, 4659–4662. doi:10.1016/s0040-4039(01)91226-2 |
| 81. | Hersh, W. H. Beilstein J. Org. Chem. 2015, 11, 184–191. doi:10.3762/bjoc.11.19 |
| 82. | Setzer, W. N.; Black, B. G.; Hovanes, B. A.; Hubbard, J. L. J. Org. Chem. 1989, 54, 1709–1713. doi:10.1021/jo00268a038 |
| 82. | Setzer, W. N.; Black, B. G.; Hovanes, B. A.; Hubbard, J. L. J. Org. Chem. 1989, 54, 1709–1713. doi:10.1021/jo00268a038 |
| 16. | Tong, J.; Liu, S.; Zhang, S.; Li, S. Z. Spectrochim. Acta, Part A 2007, 67A, 837–846. doi:10.1016/j.saa.2006.08.041 |
| 37. | Latypov, S. K.; Polyancev, F. M.; Yakhvarov, D. G.; Sinyashin, O. G. Phys. Chem. Chem. Phys. 2015, 17, 6976–6987. doi:10.1039/c5cp00240k |
| 15. | Lodewyk, M. W.; Siebert, M. R.; Tantillo, D. J.; Rablen, P. R.; Bally, T. CHESHIRE CCAT- CHEmical SHIft REpository with Coupling Constants Added To. http://cheshirenmr.info (accessed Sept 27, 2022). |
| 1. | Jain, R.; Bally, T.; Rablen, P. R. J. Org. Chem. 2009, 74, 4017–4023. doi:10.1021/jo900482q |
| 2. | Bally, T.; Rablen, P. R. J. Org. Chem. 2011, 76, 4818–4830. doi:10.1021/jo200513q |
| 3. | Lodewyk, M. W.; Siebert, M. R.; Tantillo, D. J. Chem. Rev. 2012, 112, 1839–1862. doi:10.1021/cr200106v |
| 14. | Rablen, P. R.; Pearlman, S. A.; Finkbiner, J. J. Phys. Chem. A 1999, 103, 7357–7363. doi:10.1021/jp9916889 |
| 27. | Jensen, F. J. Chem. Theory Comput. 2008, 4, 719–727. doi:10.1021/ct800013z |
| 28. | Jensen, F. J. Chem. Theory Comput. 2014, 10, 1074–1085. doi:10.1021/ct401026a |
| 80. | Lemp, O.; Balmer, M.; Reiter, K.; Weigend, F.; von Hänisch, C. Chem. Commun. 2017, 53, 7620–7623. doi:10.1039/c7cc04422d |
| 9. | Bifulco, G.; Dambruoso, P.; Gomez-Paloma, L.; Riccio, R. Chem. Rev. 2007, 107, 3744–3779. doi:10.1021/cr030733c |
| 10. | Saielli, G.; Nicolaou, K. C.; Ortiz, A.; Zhang, H.; Bagno, A. J. Am. Chem. Soc. 2011, 133, 6072–6077. doi:10.1021/ja201108a |
| 11. | Tantillo, D. J. Nat. Prod. Rep. 2013, 30, 1079–1086. doi:10.1039/c3np70028c |
| 12. | Marell, D. J.; Emond, S. J.; Kulshrestha, A.; Hoye, T. R. J. Org. Chem. 2014, 79, 752–758. doi:10.1021/jo402627s |
| 13. | Brown, S. G.; Jansma, M. J.; Hoye, T. R. J. Nat. Prod. 2012, 75, 1326–1331. doi:10.1021/np300248w |
| 57. | Zhao, Y.; Truhlar, D. G. Acc. Chem. Res. 2008, 41, 157–167. doi:10.1021/ar700111a |
| 58. | Alipour, M. Theor. Chem. Acc. 2018, 137, No. 8. doi:10.1007/s00214-017-2182-z |
| 80. | Lemp, O.; Balmer, M.; Reiter, K.; Weigend, F.; von Hänisch, C. Chem. Commun. 2017, 53, 7620–7623. doi:10.1039/c7cc04422d |
| 25. | Fleischer, U.; Schindler, M.; Kutzelnigg, W. J. Chem. Phys. 1987, 86, 6337–6347. doi:10.1063/1.452419 |
| 26. | Kutzelnigg, W.; Fleischer, U.; Schindler, M. The IGLO-Method: Ab-initio Calculation and Interpretation of NMR Chemical Shifts and Magnetic Susceptibilities. In NMR Basic Principles and Progress; Diehl, P.; Fluck, E.; Günther, H.; Cosfeld, R.; Seelig, J., Eds.; Springer-Verlag: Berlin, 1990; Vol. 23, pp 165–262. doi:10.1007/978-3-642-75932-1_3 |
| 18. | van Wüllen, C. Phys. Chem. Chem. Phys. 2000, 2, 2137–2144. doi:10.1039/b000461h |
| 21. | Chernyshev, K. A.; Krivdin, L. B. Russ. J. Org. Chem. 2010, 46, 785–790. doi:10.1134/s1070428010060023 |
| 24. | Fedorov, S. V.; Rusakov, Y. Y.; Krivdin, L. B. Magn. Reson. Chem. 2014, 52, 699–710. doi:10.1002/mrc.4122 |
| 25. | Fleischer, U.; Schindler, M.; Kutzelnigg, W. J. Chem. Phys. 1987, 86, 6337–6347. doi:10.1063/1.452419 |
| 26. | Kutzelnigg, W.; Fleischer, U.; Schindler, M. The IGLO-Method: Ab-initio Calculation and Interpretation of NMR Chemical Shifts and Magnetic Susceptibilities. In NMR Basic Principles and Progress; Diehl, P.; Fluck, E.; Günther, H.; Cosfeld, R.; Seelig, J., Eds.; Springer-Verlag: Berlin, 1990; Vol. 23, pp 165–262. doi:10.1007/978-3-642-75932-1_3 |
| 15. | Lodewyk, M. W.; Siebert, M. R.; Tantillo, D. J.; Rablen, P. R.; Bally, T. CHESHIRE CCAT- CHEmical SHIft REpository with Coupling Constants Added To. http://cheshirenmr.info (accessed Sept 27, 2022). |
| 3. | Lodewyk, M. W.; Siebert, M. R.; Tantillo, D. J. Chem. Rev. 2012, 112, 1839–1862. doi:10.1021/cr200106v |
| 15. | Lodewyk, M. W.; Siebert, M. R.; Tantillo, D. J.; Rablen, P. R.; Bally, T. CHESHIRE CCAT- CHEmical SHIft REpository with Coupling Constants Added To. http://cheshirenmr.info (accessed Sept 27, 2022). |
| 17. | Dransfeld, A.; Ragué Schleyer, P. v. Magn. Reson. Chem. 1998, 36 (Suppl. 1), S29–S43. doi:10.1002/(sici)1097-458x(199806)36:13<s29::aid-omr288>3.0.co;2-t |
| 18. | van Wüllen, C. Phys. Chem. Chem. Phys. 2000, 2, 2137–2144. doi:10.1039/b000461h |
| 19. | Patchkovskii, S.; Ziegler, T. J. Phys. Chem. A 2002, 106, 1088–1099. doi:10.1021/jp014184v |
| 20. | Rezaei-Sameti, M. J. Mol. Struct.: THEOCHEM 2008, 867, 122–124. doi:10.1016/j.theochem.2008.07.016 |
| 21. | Chernyshev, K. A.; Krivdin, L. B. Russ. J. Org. Chem. 2010, 46, 785–790. doi:10.1134/s1070428010060023 |
| 22. | Tafazzoli, M.; Ebrahimi, H. P. Phosphorus, Sulfur Silicon Relat. Elem. 2011, 186, 1491–1500. doi:10.1080/10426507.2010.520141 |
| 23. | Maryasin, B.; Zipse, H. Phys. Chem. Chem. Phys. 2011, 13, 5150–5158. doi:10.1039/c0cp02653k |
| 24. | Fedorov, S. V.; Rusakov, Y. Y.; Krivdin, L. B. Magn. Reson. Chem. 2014, 52, 699–710. doi:10.1002/mrc.4122 |
| 21. | Chernyshev, K. A.; Krivdin, L. B. Russ. J. Org. Chem. 2010, 46, 785–790. doi:10.1134/s1070428010060023 |
| 3. | Lodewyk, M. W.; Siebert, M. R.; Tantillo, D. J. Chem. Rev. 2012, 112, 1839–1862. doi:10.1021/cr200106v |
| 40. | Sarotti, A. M.; Pellegrinet, S. C. J. Org. Chem. 2009, 74, 7254–7260. doi:10.1021/jo901234h |
| 83. | Nykaza, T. V.; Ramirez, A.; Harrison, T. S.; Luzung, M. R.; Radosevich, A. T. J. Am. Chem. Soc. 2018, 140, 3103–3113. doi:10.1021/jacs.7b13803 |
| 37. | Latypov, S. K.; Polyancev, F. M.; Yakhvarov, D. G.; Sinyashin, O. G. Phys. Chem. Chem. Phys. 2015, 17, 6976–6987. doi:10.1039/c5cp00240k |
| 83. | Nykaza, T. V.; Ramirez, A.; Harrison, T. S.; Luzung, M. R.; Radosevich, A. T. J. Am. Chem. Soc. 2018, 140, 3103–3113. doi:10.1021/jacs.7b13803 |
| 21. | Chernyshev, K. A.; Krivdin, L. B. Russ. J. Org. Chem. 2010, 46, 785–790. doi:10.1134/s1070428010060023 |
| 36. | Chesnut, D. B. Chem. Phys. Lett. 2003, 380, 251–257. doi:10.1016/j.cplett.2003.08.104 |
| 87. | Katz, T. J.; Nicholson, C. R.; Reilly, C. A. J. Am. Chem. Soc. 1966, 88, 3832–3842. doi:10.1021/ja00968a029 |
| 71. | Alcaraz, J.-M.; Mathey, F. Tetrahedron Lett. 1984, 25, 4659–4662. doi:10.1016/s0040-4039(01)91226-2 |
| 81. | Hersh, W. H. Beilstein J. Org. Chem. 2015, 11, 184–191. doi:10.3762/bjoc.11.19 |
| 87. | Katz, T. J.; Nicholson, C. R.; Reilly, C. A. J. Am. Chem. Soc. 1966, 88, 3832–3842. doi:10.1021/ja00968a029 |
| 83. | Nykaza, T. V.; Ramirez, A.; Harrison, T. S.; Luzung, M. R.; Radosevich, A. T. J. Am. Chem. Soc. 2018, 140, 3103–3113. doi:10.1021/jacs.7b13803 |
| 83. | Nykaza, T. V.; Ramirez, A.; Harrison, T. S.; Luzung, M. R.; Radosevich, A. T. J. Am. Chem. Soc. 2018, 140, 3103–3113. doi:10.1021/jacs.7b13803 |
| 53. | Lantto, P.; Jackowski, K.; Makulski, W.; Olejniczak, M.; Jaszuński, M. J. Phys. Chem. A 2011, 115, 10617–10623. doi:10.1021/jp2052739 |
| 80. | Lemp, O.; Balmer, M.; Reiter, K.; Weigend, F.; von Hänisch, C. Chem. Commun. 2017, 53, 7620–7623. doi:10.1039/c7cc04422d |
| 51. | Chesnut, D. B. J. Phys. Chem. A 2005, 109, 11962–11966. doi:10.1021/jp0555910 |
| 77. | Solovieva, S. E.; Gruner, M.; Antipin, I. S.; Habicher, W. D.; Konovalov, A. I. Org. Lett. 2001, 3, 1299–1301. doi:10.1021/ol015658b |
| 84. | Cowley, A. H.; Kemp, R. A. Chem. Rev. 1985, 85, 367–382. doi:10.1021/cr00069a002 |
| 85. | Spinney, H. A.; Yap, G. P. A.; Korobkov, I.; DiLabio, G.; Richeson, D. S. Organometallics 2006, 25, 3541–3543. doi:10.1021/om060466b |
| 86. | Reiß, F.; Schulz, A.; Villinger, A. Eur. J. Inorg. Chem. 2012, 261–271. doi:10.1002/ejic.201100978 |
| 37. | Latypov, S. K.; Polyancev, F. M.; Yakhvarov, D. G.; Sinyashin, O. G. Phys. Chem. Chem. Phys. 2015, 17, 6976–6987. doi:10.1039/c5cp00240k |
| 24. | Fedorov, S. V.; Rusakov, Y. Y.; Krivdin, L. B. Magn. Reson. Chem. 2014, 52, 699–710. doi:10.1002/mrc.4122 |
| 18. | van Wüllen, C. Phys. Chem. Chem. Phys. 2000, 2, 2137–2144. doi:10.1039/b000461h |
| 37. | Latypov, S. K.; Polyancev, F. M.; Yakhvarov, D. G.; Sinyashin, O. G. Phys. Chem. Chem. Phys. 2015, 17, 6976–6987. doi:10.1039/c5cp00240k |
| 46. | Mark, V.; Dungan, C. H.; Crutchfield, M. M.; van Wazer, J. R. Top. Phosphorus Chem. 1967, 5, 227–457. |
| 47. | Tebby, J. C. CRC Handbook of Phosphorus-31 Nuclear Magnetic Resonance Data; CRC Press: Boca Raton, FL, 1991. |
| 48. | Quin, L. D.; Verkade, J. G., Eds. Phosphorus-31 NMR Spectral Properties in Compound Characterization and Structural Analysis; Wiley: New York, NY, USA, 1994. |
| 43. | Muller, N.; Lauterbur, P. C.; Goldenson, J. J. Am. Chem. Soc. 1956, 78, 3557–3561. doi:10.1021/ja01596a002 |
| 98. | Modrzejewski, M.; Hapka, M.; Chalasinski, G.; Szczesniak, M. M. J. Chem. Theory Comput. 2016, 12, 3662–3673. doi:10.1021/acs.jctc.6b00406 |
| 44. | Van Wazer, J. R.; Callis, C. F.; Shoolery, J. N.; Jones, R. C. J. Am. Chem. Soc. 1956, 78, 5715–5726. doi:10.1021/ja01603a002 |
| 92. | Tao, J.; Perdew, J. P.; Staroverov, V. N.; Scuseria, G. E. Phys. Rev. Lett. 2003, 91, 146401. doi:10.1103/physrevlett.91.146401 |
| 99. | Staroverov, V. N.; Scuseria, G. E.; Tao, J.; Perdew, J. P. J. Chem. Phys. 2003, 119, 12129–12137. doi:10.1063/1.1626543 |
| 100. | Staroverov, V. N.; Scuseria, G. E.; Tao, J.; Perdew, J. P. J. Chem. Phys. 2004, 121, 11507. doi:10.1063/1.1795692 |
| 7. | Iron, M. A. J. Chem. Theory Comput. 2017, 13, 5798–5819. doi:10.1021/acs.jctc.7b00772 |
| 90. | Mardirossian, N.; Head-Gordon, M. J. Chem. Theory Comput. 2016, 12, 4303–4325. doi:10.1021/acs.jctc.6b00637 |
| 91. | Mardirossian, N.; Head-Gordon, M. Mol. Phys. 2017, 115, 2315–2372. doi:10.1080/00268976.2017.1333644 |
| 96. | Chai, J.-D.; Head-Gordon, M. Phys. Chem. Chem. Phys. 2008, 10, 6615–6620. doi:10.1039/b810189b |
| 97. | Grimme, S.; Antony, J.; Ehrlich, S.; Krieg, H. J. Chem. Phys. 2010, 132, 154104. doi:10.1063/1.3382344 |
| 98. | Modrzejewski, M.; Hapka, M.; Chalasinski, G.; Szczesniak, M. M. J. Chem. Theory Comput. 2016, 12, 3662–3673. doi:10.1021/acs.jctc.6b00406 |
| 92. | Tao, J.; Perdew, J. P.; Staroverov, V. N.; Scuseria, G. E. Phys. Rev. Lett. 2003, 91, 146401. doi:10.1103/physrevlett.91.146401 |
| 93. | Perdew, J. P.; Ruzsinszky, A.; Tao, J.; Staroverov, V. N.; Scuseria, G. E.; Csonka, G. I. J. Chem. Phys. 2005, 123, 062201. doi:10.1063/1.1904565 |
| 94. | Su, N. Q.; Zhu, Z.; Xu, X. Proc. Natl. Acad. Sci. U. S. A. 2018, 115, 2287–2292. doi:10.1073/pnas.1713047115 |
| 95. | Zhang, I. Y.; Xu, X. Wiley Interdiscip. Rev.: Comput. Mol. Sci. 2021, 11, e1490. doi:10.1002/wcms.1490 |
| 7. | Iron, M. A. J. Chem. Theory Comput. 2017, 13, 5798–5819. doi:10.1021/acs.jctc.7b00772 |
| 15. | Lodewyk, M. W.; Siebert, M. R.; Tantillo, D. J.; Rablen, P. R.; Bally, T. CHESHIRE CCAT- CHEmical SHIft REpository with Coupling Constants Added To. http://cheshirenmr.info (accessed Sept 27, 2022). |
| 51. | Chesnut, D. B. J. Phys. Chem. A 2005, 109, 11962–11966. doi:10.1021/jp0555910 |
| 8. | Jensen, F. J. Chem. Theory Comput. 2018, 14, 4651–4661. doi:10.1021/acs.jctc.8b00477 |
| 51. | Chesnut, D. B. J. Phys. Chem. A 2005, 109, 11962–11966. doi:10.1021/jp0555910 |
| 88. | Bulo, R. E.; Jansen, H.; Ehlers, A. W.; de Kanter, F. J. J.; Schakel, M.; Lutz, M.; Spek, A. L.; Lammertsma, K. Angew. Chem., Int. Ed. 2004, 43, 714–717. doi:10.1002/anie.200351855 |
| 89. | Bulo, R. E.; Jansen, H.; Ehlers, A. W.; de Kanter, F. J. J.; Schakel, M.; Lutz, M.; Spek, A. L.; Lammertsma, K. Angew. Chem., Int. Ed. 2004, 43, 3748a–3748. doi:10.1002/anie.200490098 |
| 50. | Alajarín, M.; Molina, P.; Vidal, A.; Tovar, F. Tetrahedron 1997, 53, 13449–13472. doi:10.1016/s0040-4020(97)00855-7 |
| 91. | Mardirossian, N.; Head-Gordon, M. Mol. Phys. 2017, 115, 2315–2372. doi:10.1080/00268976.2017.1333644 |
| 18. | van Wüllen, C. Phys. Chem. Chem. Phys. 2000, 2, 2137–2144. doi:10.1039/b000461h |
| 21. | Chernyshev, K. A.; Krivdin, L. B. Russ. J. Org. Chem. 2010, 46, 785–790. doi:10.1134/s1070428010060023 |
| 26. | Kutzelnigg, W.; Fleischer, U.; Schindler, M. The IGLO-Method: Ab-initio Calculation and Interpretation of NMR Chemical Shifts and Magnetic Susceptibilities. In NMR Basic Principles and Progress; Diehl, P.; Fluck, E.; Günther, H.; Cosfeld, R.; Seelig, J., Eds.; Springer-Verlag: Berlin, 1990; Vol. 23, pp 165–262. doi:10.1007/978-3-642-75932-1_3 |
| 15. | Lodewyk, M. W.; Siebert, M. R.; Tantillo, D. J.; Rablen, P. R.; Bally, T. CHESHIRE CCAT- CHEmical SHIft REpository with Coupling Constants Added To. http://cheshirenmr.info (accessed Sept 27, 2022). |
| 90. | Mardirossian, N.; Head-Gordon, M. J. Chem. Theory Comput. 2016, 12, 4303–4325. doi:10.1021/acs.jctc.6b00637 |
| 43. | Muller, N.; Lauterbur, P. C.; Goldenson, J. J. Am. Chem. Soc. 1956, 78, 3557–3561. doi:10.1021/ja01596a002 |
| 44. | Van Wazer, J. R.; Callis, C. F.; Shoolery, J. N.; Jones, R. C. J. Am. Chem. Soc. 1956, 78, 5715–5726. doi:10.1021/ja01603a002 |
| 44. | Van Wazer, J. R.; Callis, C. F.; Shoolery, J. N.; Jones, R. C. J. Am. Chem. Soc. 1956, 78, 5715–5726. doi:10.1021/ja01603a002 |
| 49. | Nielsen, M. L.; Pustinger, J. V.; Strobel, J. J. Chem. Eng. Data 1964, 9, 167–170. doi:10.1021/je60021a003 |
| 18. | van Wüllen, C. Phys. Chem. Chem. Phys. 2000, 2, 2137–2144. doi:10.1039/b000461h |
| 19. | Patchkovskii, S.; Ziegler, T. J. Phys. Chem. A 2002, 106, 1088–1099. doi:10.1021/jp014184v |
| 52. | Zumbulyadis, N.; Dailey, B. P. Mol. Phys. 1974, 27, 633–640. doi:10.1080/00268977400100551 |
| 53. | Lantto, P.; Jackowski, K.; Makulski, W.; Olejniczak, M.; Jaszuński, M. J. Phys. Chem. A 2011, 115, 10617–10623. doi:10.1021/jp2052739 |
| 54. | Jameson, C. J.; De Dios, A.; Keith Jameson, A. Chem. Phys. Lett. 1990, 167, 575–582. doi:10.1016/0009-2614(90)85472-o |
| 98. | Modrzejewski, M.; Hapka, M.; Chalasinski, G.; Szczesniak, M. M. J. Chem. Theory Comput. 2016, 12, 3662–3673. doi:10.1021/acs.jctc.6b00406 |
| 90. | Mardirossian, N.; Head-Gordon, M. J. Chem. Theory Comput. 2016, 12, 4303–4325. doi:10.1021/acs.jctc.6b00637 |
| 105. | Peverati, R.; Truhlar, D. G. J. Phys. Chem. Lett. 2011, 2, 2810–2817. doi:10.1021/jz201170d |
| 106. | Peverati, R.; Truhlar, D. G. Phys. Chem. Chem. Phys. 2012, 14, 16187–16191. doi:10.1039/c2cp42576a |
| 97. | Grimme, S.; Antony, J.; Ehrlich, S.; Krieg, H. J. Chem. Phys. 2010, 132, 154104. doi:10.1063/1.3382344 |
| 97. | Grimme, S.; Antony, J.; Ehrlich, S.; Krieg, H. J. Chem. Phys. 2010, 132, 154104. doi:10.1063/1.3382344 |
| 98. | Modrzejewski, M.; Hapka, M.; Chalasinski, G.; Szczesniak, M. M. J. Chem. Theory Comput. 2016, 12, 3662–3673. doi:10.1021/acs.jctc.6b00406 |
| 103. | Shenderovich, I. G. Chem.: Methods 2021, 1, 61–70. doi:10.1002/cmtd.202000033 |
| 3. | Lodewyk, M. W.; Siebert, M. R.; Tantillo, D. J. Chem. Rev. 2012, 112, 1839–1862. doi:10.1021/cr200106v |
| 102. | Zhao, Y.; Truhlar, D. G. J. Chem. Phys. 2006, 125, 194101. doi:10.1063/1.2370993 |
| 18. | van Wüllen, C. Phys. Chem. Chem. Phys. 2000, 2, 2137–2144. doi:10.1039/b000461h |
| 20. | Rezaei-Sameti, M. J. Mol. Struct.: THEOCHEM 2008, 867, 122–124. doi:10.1016/j.theochem.2008.07.016 |
| 21. | Chernyshev, K. A.; Krivdin, L. B. Russ. J. Org. Chem. 2010, 46, 785–790. doi:10.1134/s1070428010060023 |
| 24. | Fedorov, S. V.; Rusakov, Y. Y.; Krivdin, L. B. Magn. Reson. Chem. 2014, 52, 699–710. doi:10.1002/mrc.4122 |
| 37. | Latypov, S. K.; Polyancev, F. M.; Yakhvarov, D. G.; Sinyashin, O. G. Phys. Chem. Chem. Phys. 2015, 17, 6976–6987. doi:10.1039/c5cp00240k |
| 90. | Mardirossian, N.; Head-Gordon, M. J. Chem. Theory Comput. 2016, 12, 4303–4325. doi:10.1021/acs.jctc.6b00637 |
| 24. | Fedorov, S. V.; Rusakov, Y. Y.; Krivdin, L. B. Magn. Reson. Chem. 2014, 52, 699–710. doi:10.1002/mrc.4122 |
| 104. | Peverati, R.; Truhlar, D. G. J. Phys. Chem. Lett. 2012, 3, 117–124. doi:10.1021/jz201525m |
| 37. | Latypov, S. K.; Polyancev, F. M.; Yakhvarov, D. G.; Sinyashin, O. G. Phys. Chem. Chem. Phys. 2015, 17, 6976–6987. doi:10.1039/c5cp00240k |
| 24. | Fedorov, S. V.; Rusakov, Y. Y.; Krivdin, L. B. Magn. Reson. Chem. 2014, 52, 699–710. doi:10.1002/mrc.4122 |
| 44. | Van Wazer, J. R.; Callis, C. F.; Shoolery, J. N.; Jones, R. C. J. Am. Chem. Soc. 1956, 78, 5715–5726. doi:10.1021/ja01603a002 |
| 57. | Zhao, Y.; Truhlar, D. G. Acc. Chem. Res. 2008, 41, 157–167. doi:10.1021/ar700111a |
| 101. | Hohenstein, E. G.; Chill, S. T.; Sherrill, C. D. J. Chem. Theory Comput. 2008, 4, 1996–2000. doi:10.1021/ct800308k |
| 52. | Zumbulyadis, N.; Dailey, B. P. Mol. Phys. 1974, 27, 633–640. doi:10.1080/00268977400100551 |
| 8. | Jensen, F. J. Chem. Theory Comput. 2018, 14, 4651–4661. doi:10.1021/acs.jctc.8b00477 |
| 72. | Hersh, W. H.; Lam, S. T.; Moskovic, D. J.; Panagiotakis, A. J. J. Org. Chem. 2012, 77, 4968–4979. doi:10.1021/jo3003776 |
| 73. | Tichotová, M.; Ešnerová, A.; Tučková, L.; Bednárová, L.; Císařová, I.; Baszczyňski, O.; Procházková, E. J. Magn. Reson. 2022, 336, 107149. doi:10.1016/j.jmr.2022.107149 |
| 71. | Alcaraz, J.-M.; Mathey, F. Tetrahedron Lett. 1984, 25, 4659–4662. doi:10.1016/s0040-4039(01)91226-2 |
| 37. | Latypov, S. K.; Polyancev, F. M.; Yakhvarov, D. G.; Sinyashin, O. G. Phys. Chem. Chem. Phys. 2015, 17, 6976–6987. doi:10.1039/c5cp00240k |
| 37. | Latypov, S. K.; Polyancev, F. M.; Yakhvarov, D. G.; Sinyashin, O. G. Phys. Chem. Chem. Phys. 2015, 17, 6976–6987. doi:10.1039/c5cp00240k |
| 44. | Van Wazer, J. R.; Callis, C. F.; Shoolery, J. N.; Jones, R. C. J. Am. Chem. Soc. 1956, 78, 5715–5726. doi:10.1021/ja01603a002 |
| 67. | Surgenor, B. A.; Bühl, M.; Slawin, A. M. Z.; Woollins, J. D.; Kilian, P. Angew. Chem., Int. Ed. 2012, 51, 10150–10153. doi:10.1002/anie.201204998 |
| 7. | Iron, M. A. J. Chem. Theory Comput. 2017, 13, 5798–5819. doi:10.1021/acs.jctc.7b00772 |
| 8. | Jensen, F. J. Chem. Theory Comput. 2018, 14, 4651–4661. doi:10.1021/acs.jctc.8b00477 |
| 107. | Laskowski, R.; Blaha, P.; Tran, F. Phys. Rev. B 2013, 87, 195130. doi:10.1103/physrevb.87.195130 |
| 44. | Van Wazer, J. R.; Callis, C. F.; Shoolery, J. N.; Jones, R. C. J. Am. Chem. Soc. 1956, 78, 5715–5726. doi:10.1021/ja01603a002 |
| 37. | Latypov, S. K.; Polyancev, F. M.; Yakhvarov, D. G.; Sinyashin, O. G. Phys. Chem. Chem. Phys. 2015, 17, 6976–6987. doi:10.1039/c5cp00240k |
| 52. | Zumbulyadis, N.; Dailey, B. P. Mol. Phys. 1974, 27, 633–640. doi:10.1080/00268977400100551 |
| 22. | Tafazzoli, M.; Ebrahimi, H. P. Phosphorus, Sulfur Silicon Relat. Elem. 2011, 186, 1491–1500. doi:10.1080/10426507.2010.520141 |
| 23. | Maryasin, B.; Zipse, H. Phys. Chem. Chem. Phys. 2011, 13, 5150–5158. doi:10.1039/c0cp02653k |
| 37. | Latypov, S. K.; Polyancev, F. M.; Yakhvarov, D. G.; Sinyashin, O. G. Phys. Chem. Chem. Phys. 2015, 17, 6976–6987. doi:10.1039/c5cp00240k |
| 37. | Latypov, S. K.; Polyancev, F. M.; Yakhvarov, D. G.; Sinyashin, O. G. Phys. Chem. Chem. Phys. 2015, 17, 6976–6987. doi:10.1039/c5cp00240k |
| 33. | Pascual-Borràs, M.; López, X.; Poblet, J. M. Phys. Chem. Chem. Phys. 2015, 17, 8723–8731. doi:10.1039/c4cp05016a |
| 15. | Lodewyk, M. W.; Siebert, M. R.; Tantillo, D. J.; Rablen, P. R.; Bally, T. CHESHIRE CCAT- CHEmical SHIft REpository with Coupling Constants Added To. http://cheshirenmr.info (accessed Sept 27, 2022). |
| 34. | Payard, P.-A.; Perego, L. A.; Grimaud, L.; Ciofini, I. Organometallics 2020, 39, 3121–3130. doi:10.1021/acs.organomet.0c00309 |
| 35. | Kondrashova, S. A.; Polyancev, F. M.; Latypov, S. K. Molecules 2022, 27, 2668. doi:10.3390/molecules27092668 |
| 8. | Jensen, F. J. Chem. Theory Comput. 2018, 14, 4651–4661. doi:10.1021/acs.jctc.8b00477 |
| 36. | Chesnut, D. B. Chem. Phys. Lett. 2003, 380, 251–257. doi:10.1016/j.cplett.2003.08.104 |
| 8. | Jensen, F. J. Chem. Theory Comput. 2018, 14, 4651–4661. doi:10.1021/acs.jctc.8b00477 |
| 29. | Přecechtělová, J.; Novák, P.; Munzarová, M. L.; Kaupp, M.; Sklenář, V. J. Am. Chem. Soc. 2010, 132, 17139–17148. doi:10.1021/ja104564g |
| 30. | Přecechtělová, J.; Munzarová, M. L.; Vaara, J.; Novotný, J.; Dračínský, M.; Sklenář, V. J. Chem. Theory Comput. 2013, 9, 1641–1656. doi:10.1021/ct300488y |
| 31. | Fukal, J.; Páv, O.; Buděšínský, M.; Šebera, J.; Sychrovský, V. Phys. Chem. Chem. Phys. 2017, 19, 31830–31841. doi:10.1039/c7cp06969c |
| 32. | Fukal, J.; Páv, O.; Buděšínský, M.; Rosenberg, I.; Šebera, J.; Sychrovský, V. Phys. Chem. Chem. Phys. 2019, 21, 9924–9934. doi:10.1039/c9cp01460h |
| 75. | Brown, J. M.; Carey, J. V.; Russell, M. J. H. Tetrahedron 1990, 46, 4877–4886. doi:10.1016/s0040-4020(01)85600-3 |
| 33. | Pascual-Borràs, M.; López, X.; Poblet, J. M. Phys. Chem. Chem. Phys. 2015, 17, 8723–8731. doi:10.1039/c4cp05016a |
| 74. | Huang, Y.; Yu, J.; Bentrude, W. G. J. Org. Chem. 1995, 60, 4767–4773. doi:10.1021/jo00120a020 |
| 8. | Jensen, F. J. Chem. Theory Comput. 2018, 14, 4651–4661. doi:10.1021/acs.jctc.8b00477 |
| 27. | Jensen, F. J. Chem. Theory Comput. 2008, 4, 719–727. doi:10.1021/ct800013z |
| 28. | Jensen, F. J. Chem. Theory Comput. 2014, 10, 1074–1085. doi:10.1021/ct401026a |
| 75. | Brown, J. M.; Carey, J. V.; Russell, M. J. H. Tetrahedron 1990, 46, 4877–4886. doi:10.1016/s0040-4020(01)85600-3 |
| 96. | Chai, J.-D.; Head-Gordon, M. Phys. Chem. Chem. Phys. 2008, 10, 6615–6620. doi:10.1039/b810189b |
| 8. | Jensen, F. J. Chem. Theory Comput. 2018, 14, 4651–4661. doi:10.1021/acs.jctc.8b00477 |
| 21. | Chernyshev, K. A.; Krivdin, L. B. Russ. J. Org. Chem. 2010, 46, 785–790. doi:10.1134/s1070428010060023 |
| 24. | Fedorov, S. V.; Rusakov, Y. Y.; Krivdin, L. B. Magn. Reson. Chem. 2014, 52, 699–710. doi:10.1002/mrc.4122 |
| 36. | Chesnut, D. B. Chem. Phys. Lett. 2003, 380, 251–257. doi:10.1016/j.cplett.2003.08.104 |
| 29. | Přecechtělová, J.; Novák, P.; Munzarová, M. L.; Kaupp, M.; Sklenář, V. J. Am. Chem. Soc. 2010, 132, 17139–17148. doi:10.1021/ja104564g |
| 30. | Přecechtělová, J.; Munzarová, M. L.; Vaara, J.; Novotný, J.; Dračínský, M.; Sklenář, V. J. Chem. Theory Comput. 2013, 9, 1641–1656. doi:10.1021/ct300488y |
| 38. | Kwan, E. E.; Liu, R. Y. J. Chem. Theory Comput. 2015, 11, 5083–5089. doi:10.1021/acs.jctc.5b00856 |
| 113. | Finley, J. H.; Denney, D. Z.; Denney, D. B. J. Am. Chem. Soc. 1969, 91, 5826–5831. doi:10.1021/ja01049a021 |
| 112. | Coskran, K. J.; Verkade, J. G. Inorg. Chem. 1965, 4, 1655–1657. doi:10.1021/ic50033a026 |
| 45. | Jones, R. A. Y.; Katritzky, A. R. Angew. Chem., Int. Ed. Engl. 1962, 1, 32–41. doi:10.1002/anie.196200321 |
| 109. | Sheldrick, G. M. Trans. Faraday Soc. 1967, 63, 1077–1082. doi:10.1039/tf9676301077 |
| 110. | Wasylishen, R. E.; Burford, N. Can. J. Chem. 1987, 65, 2707–2712. doi:10.1139/v87-449 |
| 43. | Muller, N.; Lauterbur, P. C.; Goldenson, J. J. Am. Chem. Soc. 1956, 78, 3557–3561. doi:10.1021/ja01596a002 |
| 44. | Van Wazer, J. R.; Callis, C. F.; Shoolery, J. N.; Jones, R. C. J. Am. Chem. Soc. 1956, 78, 5715–5726. doi:10.1021/ja01603a002 |
| 45. | Jones, R. A. Y.; Katritzky, A. R. Angew. Chem., Int. Ed. Engl. 1962, 1, 32–41. doi:10.1002/anie.196200321 |
| 56. | Harmony, M. D.; Laurie, V. W.; Kuczkowski, R. L.; Schwendeman, R. H.; Ramsay, D. A.; Lovas, F. J.; Lafferty, W. J.; Maki, A. G. J. Phys. Chem. Ref. Data 1979, 8, 619–721. doi:10.1063/1.555605 |
| 3. | Lodewyk, M. W.; Siebert, M. R.; Tantillo, D. J. Chem. Rev. 2012, 112, 1839–1862. doi:10.1021/cr200106v |
| 40. | Sarotti, A. M.; Pellegrinet, S. C. J. Org. Chem. 2009, 74, 7254–7260. doi:10.1021/jo901234h |
| 112. | Coskran, K. J.; Verkade, J. G. Inorg. Chem. 1965, 4, 1655–1657. doi:10.1021/ic50033a026 |
| 41. | Adamo, C.; Barone, V. J. Chem. Phys. 1999, 110, 6158–6170. doi:10.1063/1.478522 |
| 111. | Peake, S. C.; Fild, M.; Hewson, M. J. C.; Schmutzler, R. Inorg. Chem. 1971, 10, 2723–2727. doi:10.1021/ic50106a020 |
| 39. | Keal, T. W.; Tozer, D. J. J. Chem. Phys. 2003, 119, 3015–3024. doi:10.1063/1.1590634 |
| 44. | Van Wazer, J. R.; Callis, C. F.; Shoolery, J. N.; Jones, R. C. J. Am. Chem. Soc. 1956, 78, 5715–5726. doi:10.1021/ja01603a002 |
| 27. | Jensen, F. J. Chem. Theory Comput. 2008, 4, 719–727. doi:10.1021/ct800013z |
| 28. | Jensen, F. J. Chem. Theory Comput. 2014, 10, 1074–1085. doi:10.1021/ct401026a |
| 24. | Fedorov, S. V.; Rusakov, Y. Y.; Krivdin, L. B. Magn. Reson. Chem. 2014, 52, 699–710. doi:10.1002/mrc.4122 |
| 108. | Besserre, D.; Coffi-Nketsia, S. Org. Magn. Reson. 1980, 13, 313–318. doi:10.1002/mrc.1270130502 |
| 37. | Latypov, S. K.; Polyancev, F. M.; Yakhvarov, D. G.; Sinyashin, O. G. Phys. Chem. Chem. Phys. 2015, 17, 6976–6987. doi:10.1039/c5cp00240k |
| 50. | Alajarín, M.; Molina, P.; Vidal, A.; Tovar, F. Tetrahedron 1997, 53, 13449–13472. doi:10.1016/s0040-4020(97)00855-7 |
© 2023 Hersh and Chan; licensee Beilstein-Institut.
This is an open access article licensed under the terms of the Beilstein-Institut Open Access License Agreement (https://www.beilstein-journals.org/bjoc/terms), which is identical to the Creative Commons Attribution 4.0 International License (https://creativecommons.org/licenses/by/4.0). The reuse of material under this license requires that the author(s), source and license are credited. Third-party material in this article could be subject to other licenses (typically indicated in the credit line), and in this case, users are required to obtain permission from the license holder to reuse the material.