Abstract
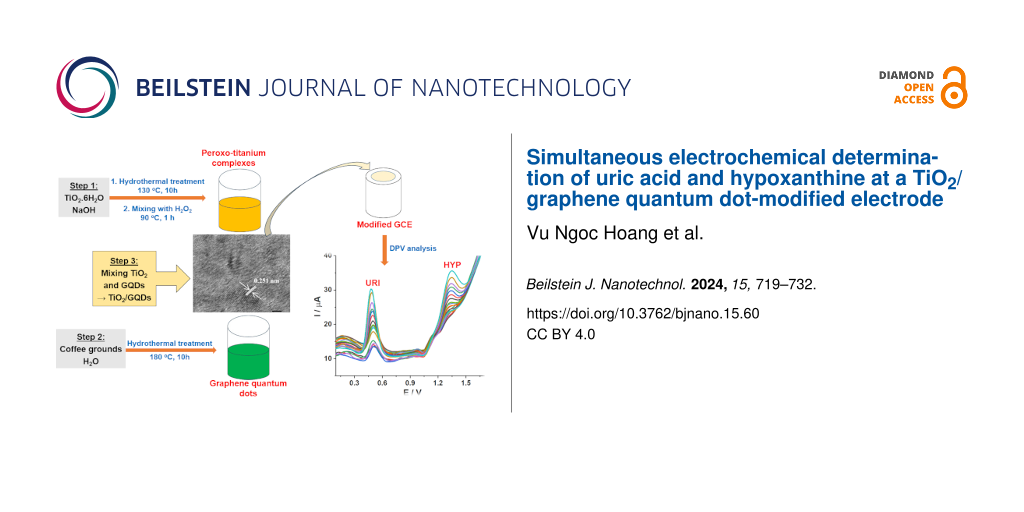
A TiO2/graphene quantum dots composite (TiO2/GQDs) obtained by in situ synthesis of GQDs, derived from coffee grounds, and peroxo titanium complexes was used as electrode modifier in the simultaneous electrochemical determination of uric acid and hypoxanthine. The TiO2/GQDs material was characterized by photoluminescence, X-ray diffraction, Raman spectroscopy, high-resolution transmission electron microscopy, and energy-dispersive X-ray mapping. The TiO2/GQDs-GCE exhibits better electrochemical activity for uric acid and hypoxanthine than GQDs/GCE or TiO2/GCE in differential pulse voltammetry (DPV) measurements. Under optimized conditions, the calibration plots were linear in the range from 1.00 to 15.26 μM for both uric acid and hypoxanthine. The limits of detection of this method were 0.58 and 0.68 μM for uric acid and hypoxanthine, respectively. The proposed DPV method was employed to determine uric acid and hypoxanthine in urine samples with acceptable recovery rates.
Introduction
Uric acid (7,9-dihydro-1H-purine-2,6,8(3H)-trione, URI) is the primary final product of the purine metabolism in humans. High concentrations of URI in serum and urine are a sign of several diseases, such as gout, Lesch–Nyan disease, obesity, diabetes, high cholesterol levels, and kidney diseases [1,2]. Hypoxanthine (6-hydroxypurine, HYP), a purine derivative, is an indicator of hypoxia [3]. A lower HYP concentration in the cerebrospinal fluid of patients compared to healthy individuals is related to Parkinson’s disease [4]. The oxidation of HYP yields xanthine, which can be further oxidized to URI. Meat from shrimp, fish, and some other animals contain large amounts of HYP. High consumption of these foods has been considered to result in elevated levels of URI, associated with the risk of gout [5]. Hence, simple and selective methods to determine the purine content in food and dietary products are of interest among researchers [6,7]. At the present time, several techniques for the determination of URI and HYP are available, such as high-performance liquid chromatography [8], liquid chromatography–tandem mass spectrometry [9], and gas chromatography/mass spectrometry [10]. These approaches require complex handling procedures. Electrochemical techniques have been considered as a robust alternative for URI and HYP sensing because of their simplicity, cost-effectiveness, and reliability. The use of modified electrodes has shown to improve significantly electrocatalytic activity and electrical conductivity of electrodes.
Graphene, with sp2-hybridized carbon atoms in a single layer, has gained much attention because of its unique physicochemical properties. Graphene quantum dots (GQDs) are zero-dimensional graphene derivatives consisting of one to few layers of graphene sheets with a size of less than 20 nm in width [11]. The missing bandgap results in an absence of luminescence in pristine graphene. However, a bandgap can be generated in GQDs through edge effects. Edge-functionalized GQDs have oxygen-containing functional groups such as hydroxy, carboxyl, carbonyl, and epoxy groups, which can conjugate to various biological/organic/inorganic molecules such as proteins, antibodies, or metal ions [12]. The capability of electron transfer/energy storage derived from their conjugate structure makes them effectively utilizable over the full light spectrum [13,14]. GQDs can be prepared through solvothermal/hydrothermal processes or carbonization from suitable organic molecules (polymers or biomass) [15]. Biomass waste (e.g., agricultural residues and food waste) is a renewable resource for the preparation of high-value carbon materials. Among food wastes, coffee grounds are a promising precursor to prepare GQDs with new functionalities regarding a more sustainable materials industry [16]. Considering the fields of catalysis and electrochemistry, combining GQDs with semiconductors, especially TiO2, has been of interest. For example, GQDs have been successfully introduced into TiO2 [17] to enhance its photocatalytic activity. John Peter et al. reported TiO2/GQDs as anodes for enhancing the short-circuit current in solar cells [18]. The lithium-ion storage performance of C-GQDs/α-Fe2O3 composites in lithium batteries presented excellent cyclability and rate capability [19]. Among several chemical approaches for the synthesis of titania, sol–gel processes have been commonly used for practical application. In these sol–gel methods, titanium alkoxides and halides are extensively used as precursors [20,21]. Because of their high reactivity, a complicate control over the reaction conditions is critical to achieve the desired crystalline structures and morphology [22]. Recently, a synthesis using stable water-soluble titanium complexes has been developed to overcome the disadvantages of these precursors and to easily obtain fine titania particles with a controlled shape [23]. The synthesis of TiO2/GQDs from water-soluble titanium complexes is expected to form a homogeneous suspension that is convenient for developing modified electrodes used in electrochemical analysis. To the best of our knowledge, there are only few reports on TiO2/GQDs for electrochemical analysis.
In the present work, TiO2/GQDs were prepared from coffee grounds and peroxo titanium complexes by a hydrothermal process. The simultaneous determination of URI and HYP using a TiO2/GQDs-modified electrode were addressed.
Experimental
Materials
Coffee grounds were collected from the local area. Anatase (98%), hydrogen chloride (39%), hydrogen peroxide (30%), boric acid (99%), phosphoric acid (85%), acetic acid (99%), uric acid (99%), and hypoxanthine (99%) were provided by the Merck company, Germany. Stock solutions of URI and HYP were prepared prior to use.
Equipment
The X-ray diffraction patterns of the suspensions of GQDs, peroxo titanium complexes, and TiO2/GQDs were recorded on a D8 Advance, Bruker, Germany with background subtraction. The morphologies of GQDs were observed by using a JEM 2100 high-resolution transmission electron microscopy (HRTEM), Joel, Japan. Raman spectroscopy measurements were performed on a WiTec, Alpha 300R with a 532 nm laser. Surface analyses of the obtained materials were carried out using a S-4800 scanning electron microscope (SEM), Hitachi (Japan). UV–vis absorption spectroscopy measurements was carried out on an 8453 UV–vis spectrophotometer, Agilent, USA. Photoluminescence (PL) spectroscopy measurements were performed on a FL3C-22 spectrophotometer, Horiba, USA.
Synthesis of TiO2/GQDs
Peroxo titanium complexes were synthesized in a hydrothermal process. 0.25 g of TiO2 and 12.5 mL of 10 M NaOH were mixed under ultrasonic stirring. The suspension was then transferred to a teflon-lined stainless steel autoclave and heated to 130 °C for 10 h. The resulting white solid was separated by centrifugation and rinsed several times with 0.1 M HCl and distilled water until a supernatant with neutral pH was obtained. The solid was dried at 80 °C for 2 h. This product was then mixed with 30 mL of H2O2 (35%, d = 1.11 g·cm3) at 90 °C under magnetic stirring for 1 h to obtain a clear yellow solution of peroxo titanium complexes. The concentration of TiO2 in the complexes was found as 0.745% (w/w) (0.25 g of TiO2 in 30 mL of H2O2).
GQDs were synthesized from coffee grounds. Coffee grounds (0.2 g) were first suspended in water (50 mL). The suspension was sonicated for 1 h before being transferred to the autoclave and heated up to 180 °C for 10 h. The resulting product was then cooled to room temperature and separated by centrifugation at 4000 rpm to obtain a dark brown solid. The concentration of GQDs calculated after subtracting the insoluble part was 0.249% (w/w) (0.125 g of coffee grounds in 50 mL of water).
TiO2/GQDs suspensions with different TiO2/GQDs ratios were prepared by mixing different volumes of GQDs and peroxo titanium complex suspensions under stirring at 50 °C for 1 h. The samples are denoted as (0:4)TiO2/GQDs; (1:4)TiO2/GQDs; (2:4)TiO2/GQDs; (4:4)TiO2/GQDs; (4:2)TiO2/GQDs; (4:1)TiO2/GQDs; (4:0)TiO2/GQDs. The numbers in parentheses stand for the volume ratio of peroxo titanium complex to GQDs solutions.
Electrochemical studies
Voltammetric measurements were performed at room temperature using a CPA-HH5 electrochemical workstation, Vietnam. A conventional three-electrode cell with a glassy carbon working electrode (GCE, 3 mm diameter), a platinum wire auxiliary electrode, and a Ag/AgCl reference electrode was used. Electrolyte solutions were prepared using doubly distilled water. Britton–Robinson (BR) buffer solutions with pH between 2 and 6 were prepared by mixing boric acid solution, phosphoric acid solution, and acetic acid solution in appropriate ratios.
To prepare a TiO2/GQDs-modified glassy carbon electrode (TiO2/GQDs-GCE), 5 mL of TiO2/GQDs suspension in water (0.1 mg/mL) was cast onto the surface of the bare GCE. The modified electrode was allowed to dry naturally for some hours at ambient temperature.
The urine samples for electrochemical measurement were prepared by first diluting 1 mL urine to 20 mL with distilled water. 1.5 mL of this urine solution was added to 2 mL of 0.25 M pH 3 buffer and was diluted to 10 mL with distilled water in an electrolysis cell. The solution was spiked with 10 µL of 500 µM URI and 20 µL of 500 µM HYT before dilution to 10 mL.
Results and Discussion
Characterization of materials
The mixtures of GQDs and TiO2/GQDs suspensions were exposed to visible and UV light to confirm their fluorescence behavior. Under visible light, the aqueous suspension of GQDs is transparent and brown in color, while the suspension of the peroxo titanium complex is opaque yellow. The prepared TiO2/GQD aqueous suspensions, in contrast, display a light yellow color, which gets darker as the ratio of TiO2/GQD in the complex increases (Figure 1a). Under 365 nm UV irradiation (Figure 1b), the GQDs displays green luminescence, while the TiO2/GQDs samples exhibit different levels of fluorescence. Figure 1c presents the emission spectra of GQDs and TiO2/GQDs. GQDs exhibits an emission maximum at 450 nm corresponding to the blue luminescence. The luminous intensity at an emission wavelength of ca. 450 nm decreases with increasing ratio of TiO2/GQDs in the material until it almost disappears when the fraction of GQDs is lower than that of TiO2. This indicates that mainly GQDs contribute to the luminescence of all samples. Figure 1d presents the UV–vis spectra of the obtained suspensions. The UV–vis spectra show absorbance bands from 200–400 nm that are typical for the colloidal systems with nanoscale particles [24,25]. The UV–vis spectrum of GQDs shows a characteristic feature of GO at ≈300 nm due to the absorption of the graphitic structure [26], while that of titanium complexes presents an absorption band at 240 nm. The combination of titanium complexes with GQDs resulted in higher adsorption λmax values.
![[2190-4286-15-60-1]](/bjnano/content/figures/2190-4286-15-60-1.png?scale=2.0&max-width=1024&background=FFFFFF)
Figure 1: Images of aqueous suspension of TiO2/GQDs samples (a) under white light and (b) under UV light. (c) Photoluminescence spectra excited at a wavelength of 365 nm. (d) UV–vis adsorption spectra of TiO2, GQDs, and TiO2/GQDs suspensions.
Figure 1: Images of aqueous suspension of TiO2/GQDs samples (a) under white light and (b) under UV light. (c)...
XRD patterns of the obtained samples in suspension form are presented in Figure 2. The XRD patterns of TiO2 and TiO2/GQDs suspensions show broad peaks of TiO2 at 2θ = 26°, corresponding to the (101) plane of the anatase phase (JCPDS file 73-1764) (Figure 2a). As the XRD measurements were made in liquids instead of solid powders, the diffraction peaks are found to be broad and weak. The diffraction peaks of the GQDs at 2θ = 30.4° can be assigned to the (002) plane of graphene. The broad nature of the diffraction peak is due to the structure of GQDs containing only few layers of graphene sheets [27]. The XRD pattern of TiO2/GQDs in solid form (dried at 100 °C for 3 h) exhibits characteristic peaks of anatase at 2θ = 25.6°, 38.1°, and 48.3°, corresponding to the (101), (004), and (200) planes, respectively. This confirms that the (1:4)TiO2/GQDs suspension contains fine anatase nanoparticles. The broadening of XRD peaks in suspension was employed to evaluate the size (Dhkl) of the crystal domains. It was calculated from the full width at half maximum (B) using the Scherrer equation ![[Graphic 1]](/bjnano/content/inline/2190-4286-15-60-i2.svg?max-width=637&scale=1.18182) , where λ is the X-ray wavelength (1.5406 Å), θ is the Bragg angle, and K is a constant (ca. 0.9). The average crystallite size of the synthesized TiO2 nanoparticles was found to be 7.1 nm. It is notable that no typical peaks for GQDs can be found in the XRD pattern of solid TiO2/GQDs. This is possibly because of the low content of GQDs in the composites, which clearly indicates that GQDs do not affect significantly TiO2 crystal structure.
, where λ is the X-ray wavelength (1.5406 Å), θ is the Bragg angle, and K is a constant (ca. 0.9). The average crystallite size of the synthesized TiO2 nanoparticles was found to be 7.1 nm. It is notable that no typical peaks for GQDs can be found in the XRD pattern of solid TiO2/GQDs. This is possibly because of the low content of GQDs in the composites, which clearly indicates that GQDs do not affect significantly TiO2 crystal structure.
![[2190-4286-15-60-2]](/bjnano/content/figures/2190-4286-15-60-2.png?scale=2.0&max-width=1024&background=FFFFFF)
Figure 2: (a) XRD patterns of TiO2, GQDs, and (1:4)TiO2/GQDs in suspension form. (b) XRD pattern of (1:4)TiO2/GQDs in solid form. (c) Raman spectra of TiO2, GQDs, and (1:4)TiO2/GQDs in solid form.
Figure 2: (a) XRD patterns of TiO2, GQDs, and (1:4)TiO2/GQDs in suspension form. (b) XRD pattern of (1:4)TiO2...
Figure 2c presents the Raman spectra of the obtained materials. Four characteristic Raman-active Eg, B1g, A1g, and Eg modes of anatase TiO2 are seen at 144, 395, 516, and 639 cm−1, respectively [28]. In the Raman spectrum of GQDs, the peak at 1353 cm−1 can be attributed to the D band, which can be assigned to the vibrations of carbon atoms because of the presence of structural defects. The peak at 1576 cm−1 can be assigned to the G band due to the vibrations of sp2-hybridized carbon atoms in graphene. The ratio of ID/IG is characteristic for the disorder of the graphene structure [29]. The characteristic vibrations for anatase are also observed in the Raman spectrum of the TiO2/GQDs sample. However, the D and G bands of GQDs shift to 1357 and 1593 cm−1, respectively, in the TiO2/GQDs spectrum. The difference in ID/IG ratio, 0.94 for GQDs and 0.71 for TiO2/GQDs, may be due to the interaction between TiO2 and GQDs.
Figure 3 presents TEM observations of the obtained materials. The morphology of TiO2 shows agglomerates of around 50–80 nm that consist of fine nanoparticles (Figure 3a), while that of GQDs shows fine spherical particles around 3–5 nm with high depression. In the composite sample, TiO2 nanoparticles of around 100 nm can be seen to be highly dispersed in the GQDs matrix (Figure 3c). The TiO2 particles in TiO2/GQDs in Figure 3d were identified by HRTEM with an interplanar distance of (101) planes of 0.251 nm, which has also been revealed by XRD of TiO2 in anatase form.
![[2190-4286-15-60-3]](/bjnano/content/figures/2190-4286-15-60-3.png?scale=2.0&max-width=1024&background=FFFFFF)
Figure 3: HRTEM images of (a) TiO2, (b) GQDs, (c) (1:4)TiO2/GQDs, and (d) of (1:4)TiO2/GQDs with high magnification.
Figure 3: HRTEM images of (a) TiO2, (b) GQDs, (c) (1:4)TiO2/GQDs, and (d) of (1:4)TiO2/GQDs with high magnifi...
To further determine the composition of the prepared TiO2/GQDs composites, EDX mapping was used (Figure 4). The obtained results reveal that TiO2/GQDs contain C (30.6%), O (55.3%), and Ti (14.1%), evenly distributed across the sample. This is in agreement with the XRD, Raman, and HRTEM observations.
![[2190-4286-15-60-4]](/bjnano/content/figures/2190-4286-15-60-4.png?scale=2.0&max-width=1024&background=FFFFFF)
Simultaneous voltammetric determination of uric acid (URI) and hypoxanthine (HYP)
Cyclic voltammetric behavior of different electrodes
The cyclic voltammetric (CV) behaviors of different electrodes are presented in Figure 5a. The CV curve of the bare GCE shows broad and weak anodic peaks of URI and HYP oxidation. The electrochemical signals are significantly enhanced when the electrode is modified with TiO2/GQDs. A well-defined oxidation peak appears at 0.45 V for URI and at 1.26 V for HYP at the TiO2/GQDs-GCE. It is notable that the electrochemical response is a function of the TiO2/GQDs composition (Figure 5b). The oxidation peak currents of URI and HYP increase with increasing amount of GQDs in TiO2/GQDs. However, the peak current of URI reaches its maximum when the GQDs reach 67% in mass (2:4)TiO2/GQDs and decreases at higher amounts of GQDs. Meanwhile, the HYP oxidation peak current is highest when the amount of GQDs reaches 80% in mass in (1:4)TiO2/GQDs. To balance between the peak currents of URI and HYP, the electrode modified by (1:4)TiO2/GQDs was chosen for further investigation. At the (1:4)TiO2/GQDs-GCE, the oxidation peak currents for URI and HYP are, respectively, 3.8 times and 5.1 times higher than those obtained at the bare GCE. URI is a weak diprotic acid with pKa1 = 5.4 and pKa2 = 9.8 [30]. HYP contains an ionizable group with pKa = 8.7 [31]. The improved reversibility and sensitivity of the modified electrode may be due to the electrostatic interaction between positively charged URI and HYP and negatively charged GQD at remaining COO− groups, the complexation of titanium to nitrogen or oxygen, or π–π interactions between the phenyl structure of purine and the planar hexagonal carbon structure of graphene.
![[2190-4286-15-60-5]](/bjnano/content/figures/2190-4286-15-60-5.png?scale=2.0&max-width=1024&background=FFFFFF)
Figure 5: (a) CV curves at different electrodes in a solution (0.05 M BR buffer, pH 4) containing CURI = CHYP = 25 µM at a potential scan rate v = 0.1 V·s−1. (b) Oxidation peak current of URI and HYP at different electrodes (the error bar represents the standard deviation of three measurements).
Figure 5: (a) CV curves at different electrodes in a solution (0.05 M BR buffer, pH 4) containing CURI = CHYP...
Effect of pH
Figure 6a presents the pH dependence of the electrochemical response. The values of Ep and Ip vary as a function of pH, indicating that the oxidation process involves the transfer of protons. The oxidation peak current of both analytes peaks at pH 3 then decreases with further increase of pH. Therefore, pH 3 was chosen for further experiments (Figure 6b). At the same time, the peak potential of both analytes shifts towards positive values with a linear relationship described by the following equations (Figure 6c):
![[Graphic 2]](/bjnano/content/inline/2190-4286-15-60-i3.svg?max-width=637&scale=1.18182)
The slopes of the EURI vs pH and EHYP vs pH plots are close to the theoretical value of the Nernst equation (0.0599), indicating that the oxidation process involves the transfer of an equal number of protons and electrons.
![[2190-4286-15-60-6]](/bjnano/content/figures/2190-4286-15-60-6.png?scale=2.0&max-width=1024&background=FFFFFF)
Figure 6: (a) CV curves of URI and HYP at equal concentrations of 25 µM in 0.05 M BR pH 2–6 at the (1:4)TiO2/GQDs-GCE; potential scan rate v = 0.1 V·s−1. (b) Oxidation peak current of URI and HYP at different pH values. (c) Linear plots of peak potential vs pH.
Figure 6: (a) CV curves of URI and HYP at equal concentrations of 25 µM in 0.05 M BR pH 2–6 at the (1:4)TiO2/...
Effect of scan rate
The effect of the scan rate on the electrochemical signals is illustrated in Figure 7a. The linear relationship between peak current and square root of scan rate is presented in Figure 7b with the following linear equations:
![[Graphic 3]](/bjnano/content/inline/2190-4286-15-60-i4.svg?max-width=637&scale=1.18182)
The lines do not pass the origin, indicating that the oxidation process of both URI and HYP are controlled by adsorption processes [32].
The relationship between peak potential and natural logarithm of scan rate is described by the Laviron equation [33] (Figure 7c).
![[Graphic 4]](/bjnano/content/inline/2190-4286-15-60-i5.svg?max-width=637&scale=1.18182)
The product nα was found as 1.2 for URI and 0.9 for HYP. For an irreversible system, α is assumed to be 0.5 [34]; therefore, n = 2.4 or 2 for URI and n = 1.8 or 2 for HYP, which indicates that the oxidation of URI and HYP involves the transfer of two electrons and two protons. Based on the above observations, plausible mechanisms for the electrooxidation of URI and HYP are proposed (Scheme 1), which are in good agreement with previous reports, where the oxidation of URI generates a bis-imine [35], and the oxidation of HYP forms 6,8-dioxypurine at the N7=C8 double bond [36].
![[2190-4286-15-60-7]](/bjnano/content/figures/2190-4286-15-60-7.png?scale=2.0&max-width=1024&background=FFFFFF)
Figure 7: (a) CV curves of (1:4)TiO2/GQDs-GCE in 0.05 M BR buffer (pH 3) with CURI = CHYP = 25 µM; scanning rate v = 0.07–0.35 V·s−1. (b) Linear curves of peak intensity as a function of v1/2. (c) Linear curves of peak potential of URI or HYP as a function of ln v.
Figure 7: (a) CV curves of (1:4)TiO2/GQDs-GCE in 0.05 M BR buffer (pH 3) with CURI = CHYP = 25 µM; scanning r...
![[2190-4286-15-60-i1]](/bjnano/content/inline/2190-4286-15-60-i1.svg?scale=2.0&max-width=1024&background=FFFFFF)
Scheme 1: Proposed oxidation mechanisms of URI and HYP at the (1:4)TiO2/GQDs-GCE.
Scheme 1: Proposed oxidation mechanisms of URI and HYP at the (1:4)TiO2/GQDs-GCE.
Relevant operational parameters
In the present work, the operational parameters accumulation potential (Eacc), accumulation time (tacc), pulse amplitude (ΔE), and potential step (Ustep) were optimized. Eacc does not significantly affect the oxidation signals (EP and IP) of URI and HYP (Supporting Information File 1, Figure S1a,b) when it is varied from −0.2 V to +0.4 V (vs Ag/AgCl|KCl 3 M). Specifically, EP and IP for the oxidation of URI remain constant at 0.510 ± 0.000 V and 13.43 ± 0.25 μA (n = 7), respectively; while the values for HYP are 1.341 ± 0.004 V and 7.204 ± 0.055 μA (n = 7), respectively. This shows that the TiO2/GQDs material interacts well with URI and HYP during the accumulation step. An Eacc value of +0.1 V with low relative standard deviation (RSD) values for IP of URI and HYP of 0.81% and 2.92%, respectively, was chosen to avoid any potential interference effect in real samples. The variation of the potential scan rate during DPV measurement reveals that the electrochemical reactions of URI and HYP are determined by adsorption. Therefore, even at tacc = 0, the IP values for URI and HYP are 3.787 ± 0.535 μA (n = 3) and 4.193 ± 0.318 μA (n = 3), respectively (Supporting Information File 1, Figure S1c,d). This phenomenon shows that URI and HYP quickly adsorb on the surface of the modified electrode at the beginning of the measurement. Therefore, when the accumulation time increases from 5 to 20 s, the IP values of URI and HYP are not statistically different. However, it is possible that the high concentration of URI and HYP in the solution might saturate on the modified electrode surface. Therefore, an accumulation time of 15 s was chosen for further studies.
The effect of pulse amplitude (ΔE) was also studied (Supporting Information File 1, Figure S2a,b). When ΔE gradually increases from 0.04 to 0.08 V, the IP of URI gradually increases, reaches the highest value at 0.10 V, and then remains constant up to ΔE of 0.12V. In contrast, the Ip of HYP rises with the increase of ΔE, peaks at 0.08 V, and then slightly decreases at higher pulse amplitudes. Furthermore, the HYP oxidation peak broadens with an increase of the peak half-width from 0.167 to 0.180 V as the pulse amplitude increases (Supporting Information File 1, Figure S2a). The oxidation peak of URI shifts positively as the pulse amplitude increases. This behavior might reduce the selectivity of the analytical method. Therefore, a pulse amplitude of 0.08 V was chosen for further studies. Ustep in differential pulse anodic stripping voltammetry affects the potential scan rate and the stripping signal. The influence of Ustep was studied in the range from 0.004 to 0.010 V corresponding to a potential scan rate from 13.3 mV·s−1 to 33.3 mV·s−1 with tstep = 0.3 s. It is clear that Ustep slightly changes the oxidation potential of both HYP and URI. Theoretically, increasing the potential step might lead to an increase of Ip. However, a high Ustep might also trigger the oxidation of other substances with similar oxidation potential, which greatly affects the simultaneous quantification of substances with stripping peaks close to each other. Therefore, a Ustep value of 0.008 V was chosen for further studies.
Linear range and limit of detection
DPV curves for mixtures containing equal concentrations of URI and HYP are shown in Figure 8a. The peak current increases linearly when the concentration of both analytes increases from 1.00 to 15.26 µM (Figure 8b). The regression equations are as follows:
![[Graphic 5]](/bjnano/content/inline/2190-4286-15-60-i6.svg?max-width=637&scale=1.18182)
The limit of detection (LOD) is described as 3S/M, where S is the standard deviation and M is the slope obtained from the calibration plot. The LOD values are 0.58 µM for URI and 0.68 µM for HYP. The cross-effect is a key factor for the simultaneous determination of analytes in a mixture. Figure 8c presents the effect of HYP concentration, which was kept constant at 15.74 μM, on the peak current intensity of different concentrations of URI. A linear response (the inset) is still found in the range of 1.00–15.74 μM with the regression equation of IURI = (0.7538 ± 0.1356) + (1.2783 ± 0.0166)CURI (R2 = 0.9988) (LODURI = 0.61 µM). A similar behavior can be observed for the oxidation of an increasing amount of HYP (1.00–15.74 μM) (inset) in the presence of 15.74 μM URI. A linear calibration curve with a regression equation of IHYP = (−0.1160 ± 0.0830) + (0.8376 ± 0.0102)CHYP (R2 = 0.9990) with LODHYP = 0.57 μM (Figure 8d) was found. These results indicate that the determination of URI in the presence of HYP and vice versa at the TiO2/GQDs-GCE can be achieved with acceptable selectivity and sensitivity. A comparison with previously reported data is shown in Table 1. It is noticed that the performance of TiO2/GQDs-GCE is better than or comparable with other electrodes with low detection limit.
![[2190-4286-15-60-8]](/bjnano/content/figures/2190-4286-15-60-8.png?scale=2.0&max-width=1024&background=FFFFFF)
Figure 8: DPV curves at the (1:4)TiO2/GQDs-GCE. (a) 0.05 M BR pH 3 with CURI = CHYP = 1.00–15.26 µM. (b) Linear plots of peak current vs URI and HYP concentration. (c) 0.05 M BR buffer (pH 3) with CURI = 1.00–15.74 µM, CHYP = 15.74 µM, the inset presents a linear plot of peak current vs URI concentration. (d) 0.05 M BR buffer (pH 3) with CHYP = 1.00–15.74 µM, CHYP = 15.74 µM, the inset presents a linear plot of peak current vs HYP concentration.
Figure 8: DPV curves at the (1:4)TiO2/GQDs-GCE. (a) 0.05 M BR pH 3 with CURI = CHYP = 1.00–15.26 µM. (b) Line...
Table 1: Comparison of URI and HYP determination at the TiO2/GQDs-GCE with the literature.
| Electrode | Method | Linear range (µM) | LOD (µM) | Applicability | Ref | ||
|---|---|---|---|---|---|---|---|
| URI | HYP | URI | HYP | ||||
| Nf–{RuDMSO–Cl–H2O}–MME/GCE | SWV | 100–700 | 50–300 | 0.372 | 2.37 | human urine samples | [37] |
| Co2Fe2O4/rGO/GCE | DPV | 2–10 | 2–10 | 0.767 | 0.506 | urine samples | [38] |
| GCE/rGO/CS/Cr2O3/GCE | DPV | 10–500 | 2–300 | 0.8 | 0.85 | fish meat | [39] |
| PDAox–PTCA/GCE | DPV | 1.8–238 | 3.8–293 | 1.50 | 1.25 | biologically species | [40] |
| β-cyclodextrin/GCE | DPV | 10–225 | 10–270 | 5 | 5 | human urine samples | [41] |
| TiO2/GQDs | DPV | 1.0–15.3 | 1.0–15.3 | 0.58 | 0.68 | urine samples | this work |
Repeatability, stability and reproducibility
The parameters for validity of the proposed approaches are the within-run precision (repeatability), reproducibility, and the within-laboratory precision (long term-stability). The repeatability of the method was evaluated by comparing the RSD of the measurement to the RSD of the Horwitz function (RSDH). If RSD is less than half of RSDH, the repeatability is acceptable. The repeatability of this method was determined by analyzing ten replicate measurements on four different mixtures containing equal concentrations of URI and HYP (2.5, 5.0, 7.5, and 10 μM). The results show that all RSDs are smaller than 5% and 0.5·RSDH (Figure 9a,b) indicating an acceptable repeatability. The reproducibility was estimated by measuring electrochemical signals of URI and HYP with seven modified electrodes fabricated using the same procedure. The peak currents (three consecutive measurements) of equal concentrations of URI and HYP (CURI = CHYP = 12 µM) at each modified electrode are given in Figure 9c. The peak currents were found as IURI = 14.99 ± 0.34 (µA) with RSD = 2.26% and IHYP = 9.00 ± 0.14 (μA) with RSD = 1.59%. An RSD smaller than 5% indicates that the proposed technique is reproducible. Stability is a critical characteristic of electrochemical sensors; it can be determined by comparing electrochemical signals from a single electrode, which is kept at 4 °C in the BR buffer pH 3 between the measurements, for a definite period. DPV measurements were periodically performed once a week. Peak currents with RSD smaller than 5% were found as IURI = 15.36 ± 0.43 (µA) (RSD = 2.82%) and IHYP = 9.03 ± 0.26 (µA) (RSD = 2.93%) indicating good long-term stability of the (1:4)TiO2/QGDs-GCE (Figure 9d).
![[2190-4286-15-60-9]](/bjnano/content/figures/2190-4286-15-60-9.png?scale=2.0&max-width=1024&background=FFFFFF)
Figure 9: The RSD of ten replicate measurements of (a) URI and (b) HYP at the (1:4)TiO2/GQDs-GCE in 0.05 M BR buffer pH 3 with CURI = CHYP = 2.5, 5.0, 7.5, and 10 µM. (c) Ip of URI and HYP (CURI = CHYP = 12 µM) in 0.05 M BR buffer pH 3 at seven different (1:4)TiO2/GQDs-GCEs fabricated using the same procedure. (d) Ip of URI and HYP (CURI = CHYP = 12 µM) in 0.05 M BR buffer pH 3 at the (1:4)TiO2/GQDs-GCE measured once a week.
Figure 9: The RSD of ten replicate measurements of (a) URI and (b) HYP at the (1:4)TiO2/GQDs-GCE in 0.05 M BR...
In order to study the selectivity of the (1:4)TiO2/GQDs-modified electrode, common co-existing substances, namely, NH4Cl, KCl, Na2SO4, NH4NO3, CaCl2, ZnCl2, glucose (GLC), glutamic acid (GLA), urea (URE), ʟ-cysteine (LCY) and xanthine (XTE), have been added to the analysis mixture containing URI (10 μM) and HYP (10 μM) to investigate the interference effect on the electrochemical responses (Figure 10 and Supporting Information File 1, Table S1). The results show that, except LCY and XTE affecting the measurement of URI and HYP at 40 and 60-fold excess, the other possible interferents exhibit no interference effect (with less than ±5% relative error) at 100-fold excess. This indicates that the designed modified electrode is a highly selective sensor for URI and HYP.
![[2190-4286-15-60-10]](/bjnano/content/figures/2190-4286-15-60-10.png?scale=2.0&max-width=1024&background=FFFFFF)
Figure 10: Effect of possible interferents. (a) Inorganic compounds and (b) organic compounds.
Figure 10: Effect of possible interferents. (a) Inorganic compounds and (b) organic compounds.
A human urine sample was used as real sample to investigate the reliability of the proposed method. The urine sample was diluted 130 times with 0.05 M BR buffer pH 3 before measurement. No other pretreatment process was required. The standard addition method was employed to test the recovery. The results show an exceptional recovery range from 96.57% to 103.58%, which clearly indicates the applicability and reliability of the proposed method (Table 2).
Table 2: Determination of URI and HYP in real samples (n = 5) with the (1:4)TiO2/GQDs-GCE.
| Sample | Analyte | Content ± SD (µM/) | Spiked (µg) | Found* ± SD (µg) | Recovery (%) |
|---|---|---|---|---|---|
| human urine 1 | URI | 2.633 ± 0.072 | 0.841 | 0.814 ± 0.029 | 96.84 |
| HYP | — | 1.361 | 1.332 ± 0.030 | 97.88 | |
| human urine 2 | URI | 2.793 ± 0.066 | 0.841 | 0.860 ± 0.027 | 102.30 |
| HYP | — | 1.361 | 1.341 ± 0.018 | 98.53 | |
| human urine 3 | URI | 4.493 ± 0.117 | 0.841 | 0.812 ± 0.023 | 96.57 |
| HYP | — | 1.361 | 1.410 ± 0.030 | 103.58 | |
Conclusion
TiO2/GQDs were prepared from peroxo titanium complexes, and GQDs were derived from ground coffee as precursor, which offers several advantages such as easy dispersion and functionalization during the synthesis. A simple strategy employing TiO2/GQDs was used to fabricate a sensitive voltammetric sensor for the determination of URI and HYP in real samples. The decoration of nanoscale TiO2 with GQDs can provide excellent electrode modification because of the combination of enlarged active surface area and strong adsorptive capability of the nanomaterials. Low LODs, high reproducibility, and simple procedures for surface modification and analysis can be considered as the advantages of the proposed DPV method.
Supporting Information
| Supporting Information File 1: Additional figures and tables. | ||
| Format: PDF | Size: 440.6 KB | Download |
Data Availability Statement
All data that supports the findings of this study is available in the published article and/or the supporting information to this article.
References
-
Alderman, M.; Aiyer, K. J. V. Curr. Med. Res. Opin. 2004, 20, 369–379. doi:10.1185/030079904125002982
Return to citation in text: [1] -
Liberopoulos, E.; Christides, D.; Elisaf, M. J. Hypertens. 2002, 20, 347. doi:10.1097/00004872-200202000-00027
Return to citation in text: [1] -
Saugstad, O. D. Pediatr. Res. 1988, 23, 143–150. doi:10.1203/00006450-198802000-00001
Return to citation in text: [1] -
Tohgi, H.; Abe, T.; Takahashi, S.; Kikuchi, T. J. Neural Transm.: Parkinson's Dis. Dementia Sect. 1993, 6, 119–126. doi:10.1007/bf02261005
Return to citation in text: [1] -
Choi, H. K.; Atkinson, K.; Karlson, E. W.; Willett, W.; Curhan, G. N. Engl. J. Med. 2004, 350, 1093–1103. doi:10.1056/nejmoa035700
Return to citation in text: [1] -
Azizpour Moallem, Q.; Beitollahi, H. Microchem. J. 2022, 177, 107261. doi:10.1016/j.microc.2022.107261
Return to citation in text: [1] -
Dervisevic, M.; Dervisevic, E.; Şenel, M. Microchim. Acta 2019, 186, No. 749. doi:10.1007/s00604-019-3842-6
Return to citation in text: [1] -
Sato, N.; Hirano, M.; Itoh, H.; Lu, P.; Okuda, S.; Nagata, K.; Okamoto, K. Gout Uric Nucleic Acids 2023, 47, 157–168. doi:10.14867/gnamtsunyo.47.2_157
Return to citation in text: [1] -
Jia, Q.; Yang, Z.; Wang, Q.; Yang, H.; Tang, X.; Zhang, H.; Cao, L.; Zhang, G. J. Sep. Sci. 2023, 46, No. 2300090. doi:10.1002/jssc.202300090
Return to citation in text: [1] -
Kuhara, T.; Tetsuo, M.; Ohse, M.; Shirakawa, T.; Nakashima, Y.; Yoshiura, K.-i.; Tanaka, N.; Taya, T. IJU Case Rep. 2023, 6, 436–439. doi:10.1002/iju5.12642
Return to citation in text: [1] -
Kalluri, A.; Debnath, D.; Dharmadhikari, B.; Patra, P. Methods Enzymol. 2018, 609, 335–354. doi:10.1016/bs.mie.2018.07.002
Return to citation in text: [1] -
Sapsford, K. E.; Algar, W. R.; Berti, L.; Gemmill, K. B.; Casey, B. J.; Oh, E.; Stewart, M. H.; Medintz, I. L. Chem. Rev. 2013, 113, 1904–2074. doi:10.1021/cr300143v
Return to citation in text: [1] -
Song, W.; Poyraz, A. S.; Meng, Y.; Ren, Z.; Chen, S.-Y.; Suib, S. L. Chem. Mater. 2014, 26, 4629–4639. doi:10.1021/cm502106v
Return to citation in text: [1] -
Sun, L.; Wu, W.; Yang, S.; Zhou, J.; Hong, M.; Xiao, X.; Ren, F.; Jiang, C. ACS Appl. Mater. Interfaces 2014, 6, 1113–1124. doi:10.1021/am404700h
Return to citation in text: [1] -
Chen, W.; Lv, G.; Hu, W.; Li, D.; Chen, S.; Dai, Z. Nanotechnol. Rev. 2018, 7, 157–185. doi:10.1515/ntrev-2017-0199
Return to citation in text: [1] -
Abbas, A.; Mariana, L. T.; Phan, A. N. Carbon 2018, 140, 77–99. doi:10.1016/j.carbon.2018.08.016
Return to citation in text: [1] -
Ni, D.; Shang, Q.; Guo, T.; Wang, X.; Wu, Y.; Guan, H.; Wang, D.; Zhang, M. Appl. Catal., B 2017, 210, 504–512. doi:10.1016/j.apcatb.2017.04.019
Return to citation in text: [1] -
Peter, I. J.; Rajamanickam, N.; Vijaya, S.; Anandan, S.; Ramachandran, K.; Nithiananthi, P. Sol. Energy Mater. Sol. Cells 2020, 205, 110239. doi:10.1016/j.solmat.2019.110239
Return to citation in text: [1] -
Zhang, Y.; Zhang, K.; Jia, K.; Liu, G.; Ren, S.; Li, K.; Long, X.; Li, M.; Qiu, J. Fuel 2019, 241, 646–652. doi:10.1016/j.fuel.2018.12.030
Return to citation in text: [1] -
Aslan Çakır, M.; Yetim, T.; Yetim, A. F.; Çelik, A. J. Mater. Eng. Perform. 2024, 33, 1472–1484. doi:10.1007/s11665-023-08049-3
Return to citation in text: [1] -
Khan, H.; Seth, M.; Samanta, S.; Jana, S. J. Sol-Gel Sci. Technol. 2020, 94, 141–153. doi:10.1007/s10971-019-05108-x
Return to citation in text: [1] -
Truong, Q. D.; Dien, L. X.; Vo, D.-V. N.; Le, T. S. J. Solid State Chem. 2017, 251, 143–163. doi:10.1016/j.jssc.2017.04.017
Return to citation in text: [1] -
Yang, M.; Liu, N.; Wang, P.; Zhao, T. Inorg. Chem. Commun. 2023, 153, 110795. doi:10.1016/j.inoche.2023.110795
Return to citation in text: [1] -
López-Muñoz, G. A.; Balderas-López, J. A.; Ortega-Lopez, J.; Pescador-Rojas, J. A.; Salazar, J. S. Nanoscale Res. Lett. 2012, 7, 667. doi:10.1186/1556-276x-7-667
Return to citation in text: [1] -
Kato, H.; Nakamura, A.; Takahashi, K.; Kinugasa, S. Phys. Chem. Chem. Phys. 2009, 11, 4946–4948. doi:10.1039/b904593g
Return to citation in text: [1] -
Ran, C.; Wang, M.; Gao, W.; Yang, Z.; Shao, J.; Deng, J.; Song, X. RSC Adv. 2014, 4, 21772–21776. doi:10.1039/c4ra03542a
Return to citation in text: [1] -
Kumar, S.; Ojha, A. K. Mater. Chem. Phys. 2016, 171, 126–136. doi:10.1016/j.matchemphys.2015.12.008
Return to citation in text: [1] -
Su, W.; Zhang, J.; Feng, Z.; Chen, T.; Ying, P.; Li, C. J. Phys. Chem. C 2008, 112, 7710–7716. doi:10.1021/jp7118422
Return to citation in text: [1] -
Qu, D.; Zheng, M.; Du, P.; Zhou, Y.; Zhang, L.; Li, D.; Tan, H.; Zhao, Z.; Xie, Z.; Sun, Z. Nanoscale 2013, 5, 12272–12277. doi:10.1039/c3nr04402e
Return to citation in text: [1] -
Chong, D. P. J. Theor. Comput. Sci. 2013, 1, No. 1000104. doi:10.4172/jtco.1000104
Return to citation in text: [1] -
Bai, B.; Wang, X.; Yang, L.; Song, H.; Yan, G.; Han, Y.; Fang, H.; Sun, H. Biomed. Chromatogr. 2023, 37, No. e5560. doi:10.1002/bmc.5560
Return to citation in text: [1] -
Soleymani, J.; Hasanzadeh, M.; Shadjou, N.; Jafari, M. K.; Gharamaleki, J. V.; Yadollahi, M.; Jouyban, A. Mater. Sci. Eng., C 2016, 61, 638–650. doi:10.1016/j.msec.2016.01.003
Return to citation in text: [1] -
Laviron, E. J. Electroanal. Chem. Interfacial Electrochem. 1979, 101, 19–28. doi:10.1016/s0022-0728(79)80075-3
Return to citation in text: [1] -
Li, C. Colloids Surf., B 2007, 55, 77–83. doi:10.1016/j.colsurfb.2006.11.009
Return to citation in text: [1] -
Huang, D.; Cheng, Y.; Xu, H.; Zhang, H.; Sheng, L.; Xu, H.; Liu, Z.; Wu, H.; Fan, S. J. Solid State Electrochem. 2015, 19, 435–443. doi:10.1007/s10008-014-2614-9
Return to citation in text: [1] -
Mathew, M. R.; Kumar, K. G. J. Electrochem. Soc. 2020, 167, No. 047519. doi:10.1149/1945-7111/ab74c1
Return to citation in text: [1] -
Kumar, A. S.; Swetha, P. J. Electroanal. Chem. 2010, 642, 135–142. doi:10.1016/j.jelechem.2010.02.031
Return to citation in text: [1] -
Hoan, N. T. V.; Minh, N. N.; Trang, N. T. H.; Thuy, L. T. T.; Van Hoang, C.; Mau, T. X.; Vu, H. X. A.; Thu, P. T. K.; Phong, N. H.; Khieu, D. Q. J. Nanomater. 2020, 2020, 9797509. doi:10.1155/2020/9797509
Return to citation in text: [1] -
Ghanbari, K.; Nejabati, F. Anal. Methods 2020, 12, 1650–1661. doi:10.1039/d0ay00161a
Return to citation in text: [1] -
Liu, X.; Ou, X.; Lu, Q.; Zhang, J.; Chen, S.; Wei, S. RSC Adv. 2014, 4, 42632–42637. doi:10.1039/c4ra05853d
Return to citation in text: [1] -
Wei, G.; Zhi-yu, D.; Li-li, C.; Da-jun, L.; Xing-quan, H. Chem. Res. Chin. Univ. 2012, 28, 1047–1053.
Return to citation in text: [1]
| 33. | Laviron, E. J. Electroanal. Chem. Interfacial Electrochem. 1979, 101, 19–28. doi:10.1016/s0022-0728(79)80075-3 |
| 35. | Huang, D.; Cheng, Y.; Xu, H.; Zhang, H.; Sheng, L.; Xu, H.; Liu, Z.; Wu, H.; Fan, S. J. Solid State Electrochem. 2015, 19, 435–443. doi:10.1007/s10008-014-2614-9 |
| 1. | Alderman, M.; Aiyer, K. J. V. Curr. Med. Res. Opin. 2004, 20, 369–379. doi:10.1185/030079904125002982 |
| 2. | Liberopoulos, E.; Christides, D.; Elisaf, M. J. Hypertens. 2002, 20, 347. doi:10.1097/00004872-200202000-00027 |
| 6. | Azizpour Moallem, Q.; Beitollahi, H. Microchem. J. 2022, 177, 107261. doi:10.1016/j.microc.2022.107261 |
| 7. | Dervisevic, M.; Dervisevic, E.; Şenel, M. Microchim. Acta 2019, 186, No. 749. doi:10.1007/s00604-019-3842-6 |
| 18. | Peter, I. J.; Rajamanickam, N.; Vijaya, S.; Anandan, S.; Ramachandran, K.; Nithiananthi, P. Sol. Energy Mater. Sol. Cells 2020, 205, 110239. doi:10.1016/j.solmat.2019.110239 |
| 5. | Choi, H. K.; Atkinson, K.; Karlson, E. W.; Willett, W.; Curhan, G. N. Engl. J. Med. 2004, 350, 1093–1103. doi:10.1056/nejmoa035700 |
| 19. | Zhang, Y.; Zhang, K.; Jia, K.; Liu, G.; Ren, S.; Li, K.; Long, X.; Li, M.; Qiu, J. Fuel 2019, 241, 646–652. doi:10.1016/j.fuel.2018.12.030 |
| 4. | Tohgi, H.; Abe, T.; Takahashi, S.; Kikuchi, T. J. Neural Transm.: Parkinson's Dis. Dementia Sect. 1993, 6, 119–126. doi:10.1007/bf02261005 |
| 16. | Abbas, A.; Mariana, L. T.; Phan, A. N. Carbon 2018, 140, 77–99. doi:10.1016/j.carbon.2018.08.016 |
| 40. | Liu, X.; Ou, X.; Lu, Q.; Zhang, J.; Chen, S.; Wei, S. RSC Adv. 2014, 4, 42632–42637. doi:10.1039/c4ra05853d |
| 3. | Saugstad, O. D. Pediatr. Res. 1988, 23, 143–150. doi:10.1203/00006450-198802000-00001 |
| 17. | Ni, D.; Shang, Q.; Guo, T.; Wang, X.; Wu, Y.; Guan, H.; Wang, D.; Zhang, M. Appl. Catal., B 2017, 210, 504–512. doi:10.1016/j.apcatb.2017.04.019 |
| 41. | Wei, G.; Zhi-yu, D.; Li-li, C.; Da-jun, L.; Xing-quan, H. Chem. Res. Chin. Univ. 2012, 28, 1047–1053. |
| 11. | Kalluri, A.; Debnath, D.; Dharmadhikari, B.; Patra, P. Methods Enzymol. 2018, 609, 335–354. doi:10.1016/bs.mie.2018.07.002 |
| 13. | Song, W.; Poyraz, A. S.; Meng, Y.; Ren, Z.; Chen, S.-Y.; Suib, S. L. Chem. Mater. 2014, 26, 4629–4639. doi:10.1021/cm502106v |
| 14. | Sun, L.; Wu, W.; Yang, S.; Zhou, J.; Hong, M.; Xiao, X.; Ren, F.; Jiang, C. ACS Appl. Mater. Interfaces 2014, 6, 1113–1124. doi:10.1021/am404700h |
| 38. | Hoan, N. T. V.; Minh, N. N.; Trang, N. T. H.; Thuy, L. T. T.; Van Hoang, C.; Mau, T. X.; Vu, H. X. A.; Thu, P. T. K.; Phong, N. H.; Khieu, D. Q. J. Nanomater. 2020, 2020, 9797509. doi:10.1155/2020/9797509 |
| 10. | Kuhara, T.; Tetsuo, M.; Ohse, M.; Shirakawa, T.; Nakashima, Y.; Yoshiura, K.-i.; Tanaka, N.; Taya, T. IJU Case Rep. 2023, 6, 436–439. doi:10.1002/iju5.12642 |
| 15. | Chen, W.; Lv, G.; Hu, W.; Li, D.; Chen, S.; Dai, Z. Nanotechnol. Rev. 2018, 7, 157–185. doi:10.1515/ntrev-2017-0199 |
| 39. | Ghanbari, K.; Nejabati, F. Anal. Methods 2020, 12, 1650–1661. doi:10.1039/d0ay00161a |
| 9. | Jia, Q.; Yang, Z.; Wang, Q.; Yang, H.; Tang, X.; Zhang, H.; Cao, L.; Zhang, G. J. Sep. Sci. 2023, 46, No. 2300090. doi:10.1002/jssc.202300090 |
| 36. | Mathew, M. R.; Kumar, K. G. J. Electrochem. Soc. 2020, 167, No. 047519. doi:10.1149/1945-7111/ab74c1 |
| 8. | Sato, N.; Hirano, M.; Itoh, H.; Lu, P.; Okuda, S.; Nagata, K.; Okamoto, K. Gout Uric Nucleic Acids 2023, 47, 157–168. doi:10.14867/gnamtsunyo.47.2_157 |
| 12. | Sapsford, K. E.; Algar, W. R.; Berti, L.; Gemmill, K. B.; Casey, B. J.; Oh, E.; Stewart, M. H.; Medintz, I. L. Chem. Rev. 2013, 113, 1904–2074. doi:10.1021/cr300143v |
| 37. | Kumar, A. S.; Swetha, P. J. Electroanal. Chem. 2010, 642, 135–142. doi:10.1016/j.jelechem.2010.02.031 |
| 23. | Yang, M.; Liu, N.; Wang, P.; Zhao, T. Inorg. Chem. Commun. 2023, 153, 110795. doi:10.1016/j.inoche.2023.110795 |
| 20. | Aslan Çakır, M.; Yetim, T.; Yetim, A. F.; Çelik, A. J. Mater. Eng. Perform. 2024, 33, 1472–1484. doi:10.1007/s11665-023-08049-3 |
| 21. | Khan, H.; Seth, M.; Samanta, S.; Jana, S. J. Sol-Gel Sci. Technol. 2020, 94, 141–153. doi:10.1007/s10971-019-05108-x |
| 22. | Truong, Q. D.; Dien, L. X.; Vo, D.-V. N.; Le, T. S. J. Solid State Chem. 2017, 251, 143–163. doi:10.1016/j.jssc.2017.04.017 |
| 31. | Bai, B.; Wang, X.; Yang, L.; Song, H.; Yan, G.; Han, Y.; Fang, H.; Sun, H. Biomed. Chromatogr. 2023, 37, No. e5560. doi:10.1002/bmc.5560 |
| 32. | Soleymani, J.; Hasanzadeh, M.; Shadjou, N.; Jafari, M. K.; Gharamaleki, J. V.; Yadollahi, M.; Jouyban, A. Mater. Sci. Eng., C 2016, 61, 638–650. doi:10.1016/j.msec.2016.01.003 |
| 29. | Qu, D.; Zheng, M.; Du, P.; Zhou, Y.; Zhang, L.; Li, D.; Tan, H.; Zhao, Z.; Xie, Z.; Sun, Z. Nanoscale 2013, 5, 12272–12277. doi:10.1039/c3nr04402e |
| 30. | Chong, D. P. J. Theor. Comput. Sci. 2013, 1, No. 1000104. doi:10.4172/jtco.1000104 |
| 27. | Kumar, S.; Ojha, A. K. Mater. Chem. Phys. 2016, 171, 126–136. doi:10.1016/j.matchemphys.2015.12.008 |
| 28. | Su, W.; Zhang, J.; Feng, Z.; Chen, T.; Ying, P.; Li, C. J. Phys. Chem. C 2008, 112, 7710–7716. doi:10.1021/jp7118422 |
| 24. | López-Muñoz, G. A.; Balderas-López, J. A.; Ortega-Lopez, J.; Pescador-Rojas, J. A.; Salazar, J. S. Nanoscale Res. Lett. 2012, 7, 667. doi:10.1186/1556-276x-7-667 |
| 25. | Kato, H.; Nakamura, A.; Takahashi, K.; Kinugasa, S. Phys. Chem. Chem. Phys. 2009, 11, 4946–4948. doi:10.1039/b904593g |
| 26. | Ran, C.; Wang, M.; Gao, W.; Yang, Z.; Shao, J.; Deng, J.; Song, X. RSC Adv. 2014, 4, 21772–21776. doi:10.1039/c4ra03542a |
© 2024 Ngoc Hoang et al.; licensee Beilstein-Institut.
This is an open access article licensed under the terms of the Beilstein-Institut Open Access License Agreement (https://www.beilstein-journals.org/bjnano/terms), which is identical to the Creative Commons Attribution 4.0 International License (https://creativecommons.org/licenses/by/4.0). The reuse of material under this license requires that the author(s), source and license are credited. Third-party material in this article could be subject to other licenses (typically indicated in the credit line), and in this case, users are required to obtain permission from the license holder to reuse the material.