Abstract
Nanoparticles (NPs) are considered as versatile tools in various fields including medicine, electronics, and environmental science. Understanding the structural aspects of surface modifiers in nanoparticles that govern their cellular uptake is crucial for optimizing their efficacy and minimizing potential cytotoxicity. The cellular uptake is influenced by multiple factors, namely, size, shape, and surface charge of NPs, as well as their surface functionalization. In the current study, classification-based ML models (i.e., Bayesian classification, random forest, support vector classifier, and linear discriminant analysis) have been developed to identify the features/fingerprints that significantly contribute to the cellular uptake of ENMOs in multiple cell types, including pancreatic cancer cells (PaCa2), human endothelial cells (HUVEC), and human macrophage cells (U937). The best models have been identified for each cell type and analyzed to detect the structural fingerprints/features governing the cellular uptake of ENMOs. The study will direct scientists in the design of ENMOs of higher cellular uptake efficiency for better therapeutic response.
Introduction
In recent years, the rapid advancement of nanotechnology has led to the widespread utilization of engineered nanostructured metal oxides (ENMOs) in various industrial and biomedical applications [1]. Nanoparticles (NPs) are described by the International Organization for Standardization as structures characterized by one, two, or three dimensions within the range of 1 to 100 nm [2]. The diminutive size of nanoparticles contributes to a significantly high surface area with respect to volume, resulting in enhanced reactivity, improved stability, and augmented functionality. In the field of nanomaterials, ENMOs are a notable subset. These nanoparticles consist of metal elements bonded with oxygen in intricate structures [3,4]. They exhibit exceptional physicochemical properties, which have led to their widespread utilization across various industries [5,6]. These nanomaterials are employed in, for example, electronics, cosmetics, and medicine because of their enhanced reactivity, large surface area, and tunable properties [7,8].
ENMOs can enter the human body [9] and engage with various biomacromolecules, including sugars, lipids, proteins, and nucleic acids. These biomolecules rapidly envelop the nanoparticle surface, creating a dynamic “protein corona”, which dictates the biological characteristics of the nanoparticles [10,11]. The composition of this corona is variable and relies on the concentrations and affinities of its different components to the nanoparticle surface. Cellular uptake of NPs happens through receptor-mediated active or passive transport across the cell membrane [12]. Excessive absorption by normal cells enables metal oxide nanoparticles to engage with various subcellular organelles, initiating diverse signaling pathways to generate a stress response within cells. This results in the production of free radicals. Ultimately, this cascade leads to damage to cellular organelles and the demise of the cell [13-15]. ENMOs have also been explored for potential diagnostic applications, particularly in targeting cancer cells [16,17]. To create target-specific NPs, researchers synthesized magnetofluorescent NPs with an iron oxide nanocore decorated with organic compounds and investigated their cellular uptake across various human cell types [18]. However, determining the cellular absorption of functionalized nanoparticles in different human cell types is a laborious, expensive, and time-consuming task. Computational analysis of experimentally obtained cellular uptake data for ENMOs provides a systematic approach to gain insights for modifying them for specific purposes. In recent times, these computational methods have gained popularity as they are more cost-effective and independent alternatives to experimental procedures [19-21].
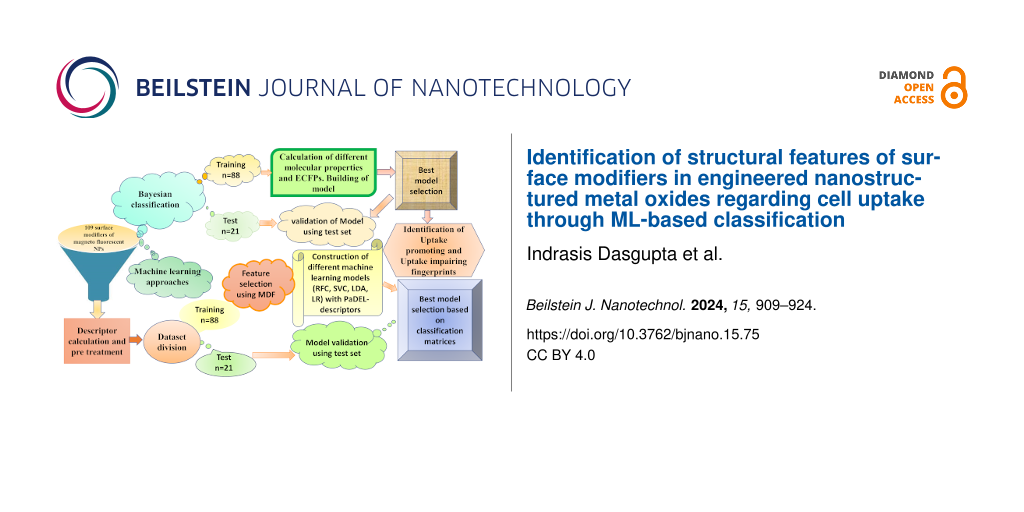
Understanding the structural features related to the surface modifiers of ENMOs that influence their uptake in human cell lines is crucial for designing nanomaterials with enhanced bioavailability. The surface modifiers are, in general, chemical groups or molecules that are attached to the surface of ENMOs to modify their properties and, specifically, the cellular uptake. A lot of computational studies (Table 1) have been reported using nanoscale quantitative structure–activity relationship (nano-QSAR) models (predominantly regression-based) that specifically employ the cellular uptake in the PaCa2 cell line [22-27]. In the current study, we have performed a distinctive approach by developing nano-QSAR machine learning-based classification models that encompass not only the cellular uptake data of the PaCa2 cell line but also the two additional cell lines HUVEC and U937. The primary objective is to find the structural fingerprints/features that govern cellular uptake selectivity for each cell line. The selective surface modifications of ENMOs could enhance the affinity of the nanoparticles for certain cell types while reducing the uptake by non-target cells. This is particularly important for in vivo applications where non-specific uptake by the reticuloendothelial system (e.g., liver and spleen) can reduce the efficacy of the nanoparticles. The workflow of the current study is shown in Figure 1. The insights gained from this study hold significant implications for the rational design of ENMOs with tailored properties for biomedical applications, ensuring their higher efficiency.
Table 1: Comparison of statistical parameters of the present model with previous studies for the cellular uptake of ENMOs.
| S. no. | Cell line | ntrain | ntest | Modela | Statistical parametersb | Ref |
| Regression-based QSAR | ||||||
| 1 | PaCa2 | 87 | 22 | — | R2Te = 0.72; RMSETe = 0.18 | [22] |
| 2 | PaCa2 | 90 | 19 | MLR | R2Tr = 0.934; RMSETr = 0.121; R2Te = 0.943; RMSETe = 0.214 | [23] |
| 3 | HUVEC | 87 | 21 | BRANNLP & MLREM | R2Tr = 0.55; RMSETr = 0.38; R2Te = 0.72; RMSETe = 0.30 | [24] |
| PaCa2 | R2Tr = 0.64; RMSETr = 0.26; R2Te = 0.62; RMSETe = 0.32 | |||||
| 4 | PaCa2 | 91 | 18 | Monte Carlo regression | R2Tr = 0.76; RMSETr =0.19; R2Te = 0.86; RMSETe = 0.14 | [25] |
| 5 | PaCa2 | 87 | 22 | MLR | R2Tr = 0.945; RMSETr = 0.13; R2Te = 0.897; RMSETe = 0.18 | [26] |
| 6 | PaCa2 | 89 | 20 | PLS | LV = 5; R2Tr = 0:806; Q2LOO = 0.758; RMSETr = 0.20; Q2F1 = R2Te = 0.879; Q2F2 = 0.868; RMSETe = 0.12 | [27] |
| 7 | HUVEC | 87 | 21 |
MLR
Bayesian regularized neural network |
R2Tr = 0.74; RMSETr = 0.34; R2Te = 0.63; RMSETe = 0.36 (linear model)
R2Tr = 0.70; RMSETr = 0.30; R2Te = 0.66; RMSETe = 0.33 (nonlinear model) |
[28] |
| PaCa2 |
R2Tr = 0.76; RMSETr = 0.19; R2Te = 0.79; RMSETe = 0.24 (linear model)
R2Tr = 0.77; RMSETr = 0.15; R2Te = 0.54; RMSETe = 0.28 (nonlinear model) |
|||||
| 8 | PaCa2 | 83 | 21 | MLR | R2Tr = 0.974; RMSETr = 0.067; R2Te = 0.944; RMSETe = 0.109 | [29] |
| HUVEC | R2Tr = 0.973; RMSETr = 0.100; R2Te = 0.966; RMSETe = 0.104 | |||||
| U937 | R2Tr = 0.977; RMSETr = 0.019; R2Te = 0.938; RMSETe = 0.023 | |||||
| 9 | PaCa2 |
36
27 15 |
9
7 3 |
MLR |
R2Tr = 0.792; Q2LOO = 0.765; RMSETr = 1929.40
R2Te = 0.954; Q2ext = 0.908; RMSETe = 581.646 (Model 1) R2Tr = 0.857; Q2LOO = 0.735; RMSETr = 1649.077 R2Te = 0.961; Q2ext = 0.923; RMSETe = 1083.365 (Model 2) R2Tr = 0.819; Q2LOO = 0.739; RMSETr = 1683.908 R2Te = 0.863; Q2ext = 0.821; RMSETe = 1683.908 (Model 3) |
[30] |
| 10 | PaCa2 | 87 | 22 | PLS | LV = 4; R2Tr = 0.814; Q2LOO = 0.782; RMSETr = 0.198; Q2F1 = 0.893; Q2F2 = 0.749 | [31] |
| HUVEC | LV = 5; R2Tr = 0.782; Q2LOO = 0.733; RMSETr = 0.299; Q2F1 = 0.704; Q2F2 = 0.668 | |||||
| U937 | LV = 5; R2Tr = 0.667; Q2LOO = 0.539; RMSETr = 0.077; Q2F1 = 0.602; Q2F2 = 0.506 | |||||
| 11 | HUVEC | 87 | 22 | MLR | R2Tr = 0.852; RMSETr = 0.235; R2Te = 0.822; RMSETe = 0.241 | [32] |
| PaCa2 | R2Tr = 0.905; RMSETr = 0.130; R2Te = 0.885; RMSETe = 0.140 | |||||
| Classification-based QSAR | ||||||
| 12 | PaCa2 | — | — | DTB |
SeTr = 1.000; SpTr = 0.974; ACCTr = 0.988; MCCTr = 0.980
SeTe = 0.882; SpTe = 1.000; ACCTe = 0.926; MCCTe = 0.860 |
[26] |
| 13 | PaCa2 | — | — | DTF |
SeTr = 1.000; SpTr = 1.000; ACCTr = 1.000; MCCTr = 1.000
SeTe = 0.875; SpTe = 0.909; ACCTe = 0.889; MCCTe = 0.780 |
|
| 14 | PaCa2 | 89 | 20 | RF |
SeTr = 0.958; SpTr = 0.976; ACCTr = 0.966; MCCTr = 0.933
SeTe = 0.909; SpTe = 1.000; ACCTe = 0.950; MCCTe = 0.905 |
[33] |
| 15 | PaCa2 | 88 | 21 | Bayesian classification | SeTr = 0.980; SpTr = 0.865; Conc.Tr = 0.932; ROCTr = 0.765; SeTe = 1.000; SpTe = 0.800; Conc.Te = 0.905; ROCTe = 0.891 | our model |
| HUVEC | SVC | SeTr = 0.952; ACCTr = 0.875; MCCTr = 0.761; ROCTr = 0.969; SeTe = 0.833; ACCTe = 0.857; MCCTe = 0.716; ROCTe = 0.870 | ||||
| U937 | LDA | SeTr = 0.827; ACCTr = 0.716; MCCTr = 0.400; ROCTr = 0.735; SeTe = 0.833; ACCTe = 0.667; MCCTe = 0.304; ROCTe = 0.630 | ||||
aVarious models reported as follows: MLR = multiple linear regression; RMSEP = root mean square error of prediction; Conc. = concordance, RF = random forest; SVC = support vector classifier, LDA = linear discriminant analysis; DTB = decision tree boost; DTF = decision tree forest; PLS = partial least squares; BRANNLP = Bayesian regularization artificial neural network, using Gaussian priors, MLREM = multiple linear regression with expectation maximization; bdifferent statistical parameters reported as follows: R2 = correlation coefficient, ACC = accuracy, MCC = Matthews correlation coefficient; ROC = receiver operating characteristic; RMSE = root mean square error; Q2LOO = cross-validated correlation coefficient; LV = latent variables; Se = sensitivity; Sp = specificity.
![[2190-4286-15-75-1]](/bjnano/content/figures/2190-4286-15-75-1.png?scale=2.0&max-width=1024&background=FFFFFF)
Figure 1: Workflow of the current study for cellular uptake of ENMOs involving different approaches such as Bayesian classification and machine learning. The similar training (n = 88) and test set (n = 21) were used in different analyses.
Figure 1: Workflow of the current study for cellular uptake of ENMOs involving different approaches such as B...
Materials and Methods
Preparation of datasets
The current study was performed employing the experimental cellular uptake data of 109 chemically attached surface modifiers of ENMOs (monocrystalline magnetic nanoparticles having overall size of 38 nm and an average of 60 ligands per nanoparticle, indicating a consistent level of attachment across different preparations) regarding human pancreatic ductal adenocarcinoma cells (PaCa2), human umbilical vein endothelial cells (HUVEC), and the human monocyte lymphoma cell line U937 [34]. PaCa2 cells are derived from a human pancreatic tumor and are adherent and epithelial in nature, providing insights into the uptake and behavior of nanoparticles in pancreatic cancer. HUVEC cells are endothelial cells derived from the vein of the umbilical cord to study vascular biology and endothelial function. U937 is a human cell line used as a model for monocyte/macrophage differentiation. The cellular uptake was represented by log10[NP]/cell, in which the concentration was represented in picomoles per cell. In order to classify the higher-uptake (assigned as “1”) and lower-uptake (assigned as “0”) surface modifiers of ENMOs, the average values of log10[NP]/cell were considered as cut-off value (Supporting Information File 1, Table S1). Thus, 62 higher-uptake and 47 lower-uptake (in the case of PaCa2 cell line); 54 higher-uptake and 55 lower-uptake (in the case of HUVEC cell line), and 64 higher-uptake and 45 lower-uptake (in the case of U937 cell line) surface modifiers of ENMOs were included in the modelling. The whole dataset was divided based on the “Diverse molecule” method in Discovery studio 3.0 software [35] into 88 modifiers in the training set (70%) and 21 modifiers in the test set (30%) for the different classification-based QSAR analyses.
Bayesian classification study
Bayesian classification was carried out via the “Create Bayesian model” protocol in Discovery Studio 3.0 [35]. To develop a model, various descriptors were collected, including molecular weight (MW), n-octanol/water partition coefficient (ALogP), number of aromatic rings (nAR), number of rings (nR), number of rotatable bonds (nBonds), number of hydrogen bond donors (nHBDs), and the number of hydrogen bond acceptors (nHBAs) [36]. Extended-connectivity fingerprints (ECFPs) or functional-class fingerprints (FCFPs) were also used for the Bayesian analysis. ECFPs are circular fingerprints that capture precise substructural features of molecules, making them suitable for predicting molecular activity and similarity search [37]. They are generated through an iterative process based on the Morgan algorithm, which assigns numeric identifiers to each atom in a molecule and updates these identifiers through several iterations. In contrast, FCFPs focus on capturing functional class information, reflecting the pharmacophore roles of atoms. Both ECFPs and FCFPs are highly customizable and have been widely adopted for various scientific applications [38,39]. The molecules from the training set were used for constructing the model, and the molecules from the test set were used for the validation. The resulting model’s statistical properties were assessed using the fivefold cross-validation procedure. Additionally, the model’s quality was evaluated by looking at the receiver operating characteristic (ROC) plot as well as specificity, sensitivity, and accuracy values [40-42].
Development of other machine learning models
Calculation of descriptors and data pre-treatment
The training set of 88 and the test set of 21 surface modifiers from Bayesian classification analysis were used for the development of other machine learning models. Different classes of 2D descriptors were calculated using PaDEL-Descriptor [43]. The data pre-treatment tool (Data Pre-TreatmentGUI 1.2 from DTC laboratory, Jadavpur University, available at http://teqip.jdvu.ac.in/QSAR_Tools/) removed some descriptors (intercorrelation cutoff > 0.90, variance cutoff < 0.0001) [44].
Feature selection
Finding the minimum number of significant features or variables in the descriptor form is a vital step in the interpretation of a ML model [45]. In our current study, the most discriminating features selection method (MDF_Identifier-v1.0 accessible at https://sites.google.com/jadavpuruniversity.in/dtc-lab-software/home) was used to find out the minimum number of required features that are responsible for classifying higher-uptake and lower-uptake surface modifiers in the case of three cell lines [46]. The descriptors that had greater values of absolute difference were taken as significant features for a particular cell line. For the study of the PaCa2 cell line, we selected ten descriptors (Supporting Information File 1, Table S2) that had an absolute difference value greater than or equal to 0.31. Similarly, for the study of HUVEC and U937 cell lines, we selected, respectively, eight (Supporting Information File 1, Table S3) and eleven descriptors (Supporting Information File 1, Table S4) that had an absolute difference greater than or equal to 0.39 and 0.19, respectively. The specific values were determined through empirical analysis, ensuring that the selected descriptors provide the best predictive performance for each cell line.
ML model development and analysis
Four classification-based ML models, namely, random forest classifier (RFC), support vector classifier (SVC), linear discriminant analysis (LDA), and logistic regression (LR) were developed in the current analysis. These models were developed using the optimized hyper parameters in the Scikit Learn package. The ML models were built by utilizing the ML classifier tool (https://sites.google.com/jadavpuruniversity.in/dtc-lab-software/home/machine-learning-model-development-guis) [47]. For applicability domain analysis, the leverages of the training and test set compounds were calculated. The applicability domain analysis was performed with the help of Hi_Calculator-v2.0, accessible at https://sites.google.com/jadavpuruniversity.in/dtc-lab-software/home [48].
Results and Discussion
Bayesian classification study for the three cell lines
PaCa2 cell line
Initially, a Bayesian classification study was carried out in order to build a classification-based QSAR model. The test set was developed with 21 molecules, whereas the training set was developed with 88 molecules. Figure 2A,B depict the ROC curves for the compounds in the training and test set of the surface modifiers of ENMOs in the PaCa2 cell line. Various statistical criteria, such as concordance, specificity, and sensitivity, were examined to characterize the model (Table 2). The developed Bayesian model has a fivefold cross-validated ROC of 0.765, indicating the model’s validity. The ROC for the test set is 0.891, indicating an acceptable external validation result. The training set’s statistical results are summarized in Table 2, showing a strong 98% sensitivity, 86.5% specificity, and 93.2% overall concordance.
![[2190-4286-15-75-2]](/bjnano/content/figures/2190-4286-15-75-2.png?scale=2.0&max-width=1024&background=FFFFFF)
Figure 2: Receiver operating characteristic plots of the training set (A, C, E) and test set (B, D, F) for the Bayesian classification analysis in the case of PaCa2 cell line (A, B), HUVEC (C, D) and U937 (E, F) cell line.
Figure 2: Receiver operating characteristic plots of the training set (A, C, E) and test set (B, D, F) for th...
Table 2: Validation parameters of the generated classification-based Bayesian model for different cell lines.
| Cell line | Set | TPa | FNb | FPc | TNd | Sene | Specf | Concg | ROCh |
| PaCa2 | training | 50 | 1 | 5 | 32 | 0.980 | 0.865 | 0.932 | 0.765 |
| test | 11 | 0 | 2 | 8 | 1.000 | 0.800 | 0.905 | 0.891 | |
| HUVEC | training | 39 | 3 | 5 | 41 | 0.929 | 0.891 | 0.909 | 0.854 |
| test | 10 | 2 | 1 | 8 | 0.833 | 0.889 | 0.857 | 0.861 | |
| U937 | training | 52 | 0 | 14 | 22 | 1.000 | 0.611 | 0.841 | 0.682 |
| test | 6 | 6 | 4 | 5 | 0.500 | 0.556 | 0.524 | 0.565 | |
aTrue positive; bfalse negative; cfalse positive; dtrue negative; esensitivity; fspecificity; gconcordance; hreceiver operating characteristic.
Twenty uptake-promoting (UPp 1–UPp 20) and twenty uptake-impairing (UIp 1–UIp 20) structural features/fingerprints were generated by the Bayesian model of 109 surface modifiers. As seen in Figure 3, uptake-promoting and uptake-impairing fingerprints can be matched into fewer structural features/fingerprint groups, as explained below.
![[2190-4286-15-75-3]](/bjnano/content/figures/2190-4286-15-75-3.png?scale=2.0&max-width=1024&background=FFFFFF)
Figure 3: Uptake-promoting (UPp 1–UPp 20) and uptake-impairing (UIp 1–UIp 20) fingerprints from the Bayesian study (PaCa2 cell line). Sc denotes the Bayesian score of the corresponding fingerprints.
Figure 3: Uptake-promoting (UPp 1–UPp 20) and uptake-impairing (UIp 1–UIp 20) fingerprints from the Bayesian ...
A long aliphatic carbon chain of the surface modifiers in ENMOs is highly beneficial for improved uptake in the PaCa2 cell line as suggested by the fingerprints UPp 3, UPp 4, UPp 5, UPp 9, UPp 19, and UPp 20. For example, surface modifiers 68 and 73 have these essential fingerprints and exhibit higher uptake (Supporting Information File 1, Figure S1). The uptake of ENMOs with surface modifiers like 49 is also high because of the presence of long-chain aliphatic anhydride-like fingerprints such as in UPp 11, UPp 12, UPp 13, UPp 14, UPp 16, and UPp 18. The fingerprints UPp 2 and UPp 6 share the similarity of a dihydro-2H-pyran-2,6(3H)-dione structure. These fingerprints are seen in surface modifiers 18 and 28.
The uptake-impairing fingerprints UIp 12, UIp 15, UIp 16, and UIp 18 indicate the presence of aliphatic/cyclic alcohol-like structures in the surface modifiers, and a negative impact on cell uptake of ENMOs is shown in the case of surface modifier 59. Similarly, fingerprints UIp 2, UIp 3, UIp 6, UIp 8, UIp 13, and UIp 19 represent the presence of amino groups with a possible carboxyl functionality. Such fingerprints are observed in surface modifier 101. The fingerprints UIp 9, UIp 11, UIp 14, and UIp 20, having a cyclohexane ring (e.g., 90), also reduce the uptake of ENMOs in the PaCa2 cell line.
HUVEC cell line
In the case of the HUVEC cell line, the fivefold cross-validated ROC values for the training set and test set are 0.854 and 0.861, respectively. The ROC plots (Figure 2C,D) have been generated to justify the internal and external predictability of the model. The statistical factors sensitivity, specificity, and concordance are reported in Table 2. The presence of the aliphatic anhydride-like fingerprints UPh 9, UPh 10, UPh 17, and UPh 18 (Figure 4) in the surface modifiers promotes uptake in the HUVEC cell line (Supporting Information File 1, Figure S3). As discussed previously, similar fingerprints are also important for the uptake in the case of the PaCa2 cell line. Furthermore, fingerprints like UPh 13, UPh 14 and UPh 16, having ester functionality, are also responsible for a higher uptake of ENMOs in the HUVEC cell line. Fingerprints having a dihydrofuran-2,5-dione scaffold (UPh 3, UPh 4, UPh 8, and UPh 20) in the surface modifiers are important for the higher uptake of ENMOs in the HUVEC cell line, too. This is shown in the case of surface modifier 30 (Figure S3, Supporting Information File 1). The presence of fingerprints like UPh 1, UPh 5, and UPh 7 are also important for the uptake of ENMOs in the HUVEC cell line as shown in the case of surface modifier 46.
![[2190-4286-15-75-4]](/bjnano/content/figures/2190-4286-15-75-4.png?scale=2.0&max-width=1024&background=FFFFFF)
Figure 4: Uptake-promoting (UPh 1–UPh 20) and uptake-impairing (UIh 1–UIh 20) fingerprints from the Bayesian study (HUVEC cell line). Sc denotes the Bayesian score of the corresponding fingerprints.
Figure 4: Uptake-promoting (UPh 1–UPh 20) and uptake-impairing (UIh 1–UIh 20) fingerprints from the Bayesian ...
However, fingerprints containing aliphatic amino functionality (UIh 1, UIh 2, UIh 7, UIh 8, UIh 9, and UIh 11) have a deleterious effect on the uptake of ENMOs in the HUVEC cell line, as demonstrated in in the case of surface modifier 74 (Supporting Information File 1, Figure S4). The fingerprints UIh 5, UIh 10, UIh 13, UIh 15, and UIh 18 with a branched aliphatic structure have a negative impact on the uptake of ENMOs. As discussed previously in the case of the PaCa2 cell line, aliphatic alcohol-related fingerprints, such as UIh 12 and UIh 17, also impair uptake in the HUVEC cell line. Other fingerprints responsible for impairing uptake in the HUVEC cell line include UIh 3, UIh 6, and UIh 14. These fingerprints suggest uptake impairment of ENMOs by the presence of a carboxyl group with or without amino functionality in the surface modifiers as shown in Figure S4 (Supporting Information File 1).
U937 cell line
The ROC curves for the U937 cell line are shown in Figure 2E,F for training and test set separately, and the statistical parameters for the model are shown in Table 2. The training set has sensitivity = 1.000, specificity = 0.611, and concordance = 0.841. The test set has sensitivity = 0.841, specificity = 0.556, and concordance = 0.524. The statistical quality of the Bayesian classification model for the U937 cell line is inferior compared to the models for the other cell lines. The training and test sets have also shown lower ROC scores of 0.682 and 0.565, respectively.
For U937, the Bayesian model also yielded 20 favorable fingerprints (UPu 1–UPu 20) and 20 unfavorable fingerprints (UIu 1–UIu 20) using ECFP_6 fingerprint descriptors, as shown in Figure 5. The fragments UPu 8–UPu 10 highlight the significance of the long aliphatic chain for the increased uptake of ENMOs as shown in the case of surface modifier 68. The fingerprints having anhydride functionality, for example, UPu 3, UPu 11, UPu 13, and UPu 14, are important for the uptake of ENMOs in the case of the U937 cell line (surface modifier 49 in Supporting Information File 1, Figure S5). The presence of dihydrofuran-2,5-dione scaffold-like structures in fingerprints including UPu 4, UPu 7, and UPu 15 is also important for the uptake of ENMOs in the U937 cell line (surface modifier 54 in in Supporting Information File 1, Figure S5). A similar feature is found to be important also in the case of the HUVEC cell line as discussed previously. Other fingerprints promoting uptake in the U937 cell line (UPu 5, UPu 16, and UPu 20) have an ester functionality (Supporting Information File 1, Figure S5). The higher uptake of ENMOs with surface modifier 86 is due to the presence of fingerprints UPu 12 and UPu 18.
![[2190-4286-15-75-5]](/bjnano/content/figures/2190-4286-15-75-5.png?scale=2.0&max-width=1024&background=FFFFFF)
Figure 5: Uptake-promoting (UPu 1–UPu 20) and uptake-impairing (UIu 1–UIu 20) fingerprints from the Bayesian study (U937 cell line). Sc denotes the Bayesian score of the corresponding fingerprints.
Figure 5: Uptake-promoting (UPu 1–UPu 20) and uptake-impairing (UIu 1–UIu 20) fingerprints from the Bayesian ...
The uptake-impairing fingerprints UIu 1, UIu 4, UIu 11, UIu 12, and UIu 14 indicate the presence of aliphatic alcohol functionality. The presence of primary or secondary amino groups (UIu 2, UIu 5, UIu 8, UIu 9, UIu 10, and UIu 16) also has a negative impact on the uptake of ENMOs in the U937 cell line as illustrated in the case of surface modifier 22 (Supporting Information File 1, Figure S6).
Other machine learning models
Other classification-based machine learning (ML) models (RFC, SVC, LDA, and LR) were also developed individually for the three cell lines (PaCa2, HUVEC, and U937) for the 109 surface modifiers of magnetofluorescent ENMOs. Various statistical parameters were evaluated for the selection of the best ML model. Regarding classification-based validation measures (Table 3), the random forest (RF) model exhibited the highest performance for the PaCa2 cell line, while the support vector classifier (SVC) model demonstrated superior performance for the HUVEC cell line. The linear discriminant analysis (LDA) model performed best for the U937 cell line. Figure 6A–F depicts the ROC curves for the compounds in the training and test sets of each cell line. The best ML model (RF) for the PaCa2 cell line has fivefold cross-validated ROC values of 0.939 for the training set and 0.818 for the test set, which indicates an acceptable internal and external validation result. The best ML model (SVC) for the HUVEC cell line has fivefold cross-validated ROC values of 0.969 for the training set and 0.870 for the test set, indicating that the internal and external validation result is acceptable. Last, the best ML model for the U937 cell line (LDA) has fivefold cross-validated ROC values of 0.735 for the training set and 0.630 for the test set. The detailed statistical analysis is presented in Table 3. The applicability domain analysis was also performed in order to check the chemical space of training and test set of surface modifiers of ENMOs. Based on the leverage calculation, surface modifiers 16, 48, 78, 79, 83, 86, and 107 from the training set and 82 from the test set are outliers for the classification model of the cellular uptake data for PaCa2 cell line. Similarly, based on the leverage calculation, surface modifiers 48, 83, 86, and 107 in the training set and 13, 40, and 109 in the test set are outliers for the classification model of the cellular uptake data for HUVEC cell line. For the developed classification model for the U937 cell line, surface modifiers 48, 59, 80, 83, and 97 from the training set and 10, 82, 95, and 109 from the test set are outliers.
Table 3: Validation parameters of the classification-based ML models for PaCa2, HUVEC, and U937 cell line.
| Cell line | Model Type | Set | Accuracy | Precision | Recall | F1 score | MCCa | Cohen’s k | AUC-ROCb |
| PaCa2 | RFC | training | 0.852 | 0.807 | 0.980 | 0.885 | 0.710 | 0.684 | 0.939 |
| test | 0.857 | 0.786 | 1.000 | 0.880 | 0.742 | 0.710 | 0.818 | ||
| SVC | training | 0.739 | 0.750 | 0.823 | 0.785 | 0.457 | 0.454 | 0.791 | |
| test | 0.619 | 0.636 | 0.636 | 0.636 | 0.236 | 0.236 | 0.536 | ||
| LDA | training | 0.818 | 0.769 | 0.980 | 0.862 | 0.646 | 0.607 | 0.862 | |
| test | 0.857 | 0.786 | 1.000 | 0.880 | 0.742 | 0.710 | 0.855 | ||
| LR | training | 0.830 | 0.781 | 0.980 | 0.870 | 0.667 | 0.632 | 0.874 | |
| test | 0.857 | 0.786 | 1.000 | 0.880 | 0.742 | 0.710 | 0.873 | ||
| HUVEC | RFC | training | 0.841 | 0.780 | 0.929 | 0.848 | 0.695 | 0.684 | 0.970 |
| test | 0.905 | 0.917 | 0.917 | 0.917 | 0.806 | 0.806 | 0.889 | ||
| SVC | training | 0.875 | 0.816 | 0.952 | 0.879 | 0.761 | 0.751 | 0.969 | |
| test | 0.857 | 0.909 | 0.833 | 0.870 | 0.716 | 0.712 | 0.870 | ||
| LDA | training | 0.841 | 0.792 | 0.905 | 0.844 | 0.690 | 0.683 | 0.934 | |
| test | 0.905 | 0.917 | 0.917 | 0.917 | 0.806 | 0.806 | 0.889 | ||
| LR | training | 0.830 | 0.765 | 0.929 | 0.839 | 0.676 | 0.662 | 0.891 | |
| test | 0.905 | 0.917 | 0.917 | 0.917 | 0.806 | 0.806 | 0.944 | ||
| U937 | RF | training | 0.739 | 0.754 | 0.827 | 0.789 | 0.451 | 0.448 | 0.744 |
| test | 0.619 | 0.667 | 0.667 | 0.667 | 0.222 | 0.222 | 0.611 | ||
| SVC | training | 0.693 | 0.698 | 0.846 | 0.765 | 0.347 | 0.334 | 0.687 | |
| test | 0.667 | 0.667 | 0.833 | 0.741 | 0.304 | 0.290 | 0.630 | ||
| LDA | training | 0.716 | 0.729 | 0.827 | 0.775 | 0.400 | 0.394 | 0.735 | |
| test | 0.667 | 0.667 | 0.833 | 0.741 | 0.304 | 0.290 | 0.630 | ||
| LR | training | 0.693 | 0.698 | 0.846 | 0.765 | 0.347 | 0.334 | 0.699 | |
| test | 0.667 | 0.667 | 0.833 | 0.741 | 0.304 | 0.290 | 0.685 | ||
aMatthew’s correlation coefficient; barea under the receiver operating characteristic curve.
![[2190-4286-15-75-6]](/bjnano/content/figures/2190-4286-15-75-6.png?scale=2.0&max-width=1024&background=FFFFFF)
Figure 6: Receiver operating characteristic plots of training set (A, C, E) and test set (B, D, F) for the ML-based classification models in the case of PaCa2 Cell line (A, B), HUVEC (C, D) and U937 (E, F) Cell line.
Figure 6: Receiver operating characteristic plots of training set (A, C, E) and test set (B, D, F) for the ML...
Interpretation of the descriptors of the best ML based classification models
According to OECD Principle 5 on the validation of QSAR models, it is very important to give a mechanistic interpretation of the descriptors that have a significant contribution to the model output [49]. In the current study, SHapley Additive exPlanation (SHAP) analysis was performed on the training datasets for the three cell lines using the best identified models. An increased value with a greater spreading from the mean identify the most important descriptors in the SHAP summary plot.
PaCa2 cell line
The SHAP summary plot for the classification random forest model of cellular uptake data of ENMOs in the PaCa2 cell line is shown in Figure 7. The descriptors nHBDon_Lipinski, AATS7i, minHsNH2, maxsNH2, maxHBint3, maxHBd, minHBint3, maxHsOH, maxssO, and minsOH are mentioned in descending order of importance. The details of the descriptors along with their definitions are given in Supporting Information File 1, Table S2.
![[2190-4286-15-75-7]](/bjnano/content/figures/2190-4286-15-75-7.png?scale=2.0&max-width=1024&background=FFFFFF)
Figure 7: SHAP summary plot for the ML-based RFC model (training set) in the case of PaCa2 cell line.
Figure 7: SHAP summary plot for the ML-based RFC model (training set) in the case of PaCa2 cell line.
nHBDon_Lipinski was identified as the most highly contributing feature in the developed model for the PaCa2 cell line. The descriptor nHBDon_Lipinski is associated with Lipinski’s “rule of five” where “nHBDon” stands for the number of hydrogen bond donors present in a molecule [50]. Hydrogen bonds play an important role in interactions between molecules in various biological processes. However, for cellular uptake in the PaCa2 cell line, the contribution of hydrogen bonds has a negative impact as shown in Figure 7. A higher value of nHBDon_Lipinski leads to lower chances of cellular uptake of ENMOs (e.g., 92, 97, and 99). The second significant descriptor according to SHAP analysis (Figure 7) is AATS7i. The descriptor AATS7i is an averaged Moreau–Broto autocorrelation of lag 7 weighted by ionization potential. This descriptor adds the ionization potential with the Moreau–Broto autocorrelation to measure the structural and electronic properties of surface modifiers [51] and has a negative impact on the cellular uptake of ENMOs. For example, in the case of surface modifiers 11, 24, 59, and 97, higher values of the AATS7i descriptor result in a lower cellular uptake of ENMOs in the PaCa2 cell line. Conversely, surface modifiers 2, 4, 17, and 20 show higher cellular uptake of ENMOs in the PaCa2 cell line while having low values of the AATS7i descriptor. The next descriptor according to SHAP analysis is minHsNH2, which refers to the minimum atom-type E-state indices for the amino (–NH2) hydrogens in a molecule [52]. It is observed that the surface modifiers 87, 88, 94, and 98, which have a higher value of the minHsNH2 descriptor, are not suitable as structural modifiers of ENMOs for the higher cellular uptake in the PaCa2 cell line. Surface modifiers 8, 17, and 20 cause higher cellular uptake of the ENMOs in the PaCa2 cell line, and they have a value of zero for the descriptor minHsNH2. Thus, based on the outcomes of the previous Bayesian classification model (UIp 10, UIp 13, and UIp 14 fingerprints in Figure 3) and the current machine learning analyses (Figure 7), it can be concluded that the presence of an amino group in the structure of surface modifiers of ENMOs is not conducive to higher cellular uptake in the PaCa2 cell line. The fourth negatively contributing descriptor in the model output was maxsNH2. In simple terms, the maxsNH2 value indicates the maximum electronic state value of a single-bonded NH2 group [53]. It is observed that the structures of surface modifiers 74, 77, and 93 are not suitable for higher cellular uptake of ENMOs in the PaCa2 cell line because of the increased maxsNH2 values. Conversely, the values of maxsNH2 in compounds 1, 2, and 4 are zero, and these surface modifiers lead to higher cellular uptake in the PaCa2 cell line. This is also suggested by our previous Bayesian classification model (UIp 2 and UIp 3 fingerprints in Figure 3). The fifth negatively contributing descriptor in the model output is maxHBint3 [54]. The increased maxHBint3 values of surface modifiers 87, 88, and 94 indicate that the latter are not suitable for higher cellular uptake of ENMOs in the PaCa2 cell line. The descriptor maxHBd signifies the maximum E-states for (strong) hydrogen bond donors [55] and contributes negatively to model output (Figure 7). The next negatively contributing descriptor is minHBint3. Basically, minHBint3 means the minimum E-state descriptors of strength for prospective hydrogen bonds separated by three edges [56]. The negative impact of this descriptor is reinforced by examining compounds 2, 4, 8, and 14, where the zero value of the minHBint3 descriptor correlates with higher cellular uptake of ENMOs in the PaCa2 cell line. The negatively contributing descriptor maxHsOH refers to the maximum atom-type E-state indices for the hydroxy (–OH) hydrogen in a molecule [57]. The negative contribution is supported by the observation of our previous Bayesian classification model (UIp 12, UIp 15, and UIp 16 fingerprints in Figure 3). The surface modifiers 1, 2, 8, and 17 are characterized by a zero value of the maxHsOH descriptor and are very much suitable for achieving higher cellular uptake of ENMOs in the PaCa2 cell line. The descriptor maxssO denotes the maximum electronic states of the ether-type oxygen (–O–) present in the structure of a compound [58]. It has been observed that the surface modifiers 23, 29, and 49, which have a higher value of the maxssO descriptor, are suitable for the higher cellular uptake of ENMOs in the PaCa2 cell line. In our previous Bayesian classification analysis, we identified similar favorable fingerprints (UPp 11, UPp 12, UPp 13, and UPp 14 fingerprints in Figure 3) for the cellular uptake of ENMOs in the PaCa2 cell line. The descriptor minsOH [59] makes a negative contribution to the final ML model. The descriptor minsOH stands for minimum electronic state value for the single bonded hydroxy group (–OH) present in a structure. It has been observed that the surface modifiers 30, 78, and 79, which have a higher value of the minsOH descriptor, are not suitable for the cellular uptake of ENMOs in the PaCa2 cell line.
HUVEC cell line
SHAP analysis on the training dataset of the ML-based support vector classification model for the cellular uptake in HUVEC cell line was performed for the identification of descriptors (Supporting Information File 1, Table S3) to the final model output (Figure 8). Figure 8 shows the important descriptors ndssC, maxHBd, SsNH2, maxssO, maxsNH2, SRW9, nssO, and minHsNH2 in descending order.
![[2190-4286-15-75-8]](/bjnano/content/figures/2190-4286-15-75-8.png?scale=2.0&max-width=1024&background=FFFFFF)
Figure 8: SHAP summary plot for the ML-based SVC model (training set) for the HUVEC cell line.
Figure 8: SHAP summary plot for the ML-based SVC model (training set) for the HUVEC cell line.
Descriptor ndssC is recognized as the most contributing descriptor in the developed model and it denotes the total number of double bonded carbons present in the structure [60]. The positive contribution of the descriptor is confirmed by the presence of maximum double-bonded carbons in the structures (e.g., 39, 43, and 46), which actively contribute to a higher cellular uptake of ENMOs in the case of the HUVEC cell line. From the earlier Bayesian analysis, it was also identified that certain favorable fingerprints (UPh 2 and UPh 14 fingerprints in Figure 4) include a double-bonded carbon in the structure for better cellular uptake.
The descriptor maxHBd indicates the maximum E-States for (strong) hydrogen bond donors [55] and contributes negatively to model output (Figure 8). For example, surface modifiers 88, 94, 98, and 100 are not appropriate for increasing the cellular uptake of ENMOs in the HUVEC cell line, indicated by their high maxHBd values. The third most contributing descriptor was SsNH2. In simple terms, the SsNH2 value indicates the summation value of the electronic state of a single-bonded NH2 group present in a compound [61]. Higher values of SsNH2 have a negative impact on the cellular uptake of ENMOs in the HUVEC cell line (e.g., 71, 76, 80, and 92). The Bayesian classification model also revealed that fingerprints UIh 7, UIh 8, and UIh 9 in Figure 4, containing an NH2 group, are unsuitable as structural modifiers of ENMOs for higher uptake in the HUVEC cell line.
The next descriptor that has been identified for its negative contribution is maxssO. The descriptor maxssO denotes the maximum electronic states of the ether-type oxygen (–O–) present in the structures of a compound [58]. It has been observed in most of the cases that the surface modifiers 15, 18, 27, and 37, which have a higher value of the maxssO descriptor, are not suitable for the higher cellular uptake of ENMOs in the HUVEC cell line. The fifth negatively contributing descriptor in the model output was maxsNH2. The maxsNH2 value indicates the maximum electronic state value of a single-bonded NH2 group [53]. Higher values of maxsNH2 lead to a lower cellular uptake of ENMOs in the HUVEC cell line (e.g., 1, 2, 14, and 104). The aforementioned observation was previously noted in the Bayesian classification analysis, where certain unfavorable fingerprints (UIh 7, UIh 8, and UIh 9 fingerprints in Figure 4) containing an NH2 group in their structure were identified. The other descriptors like SRW9 [62], nssO [63], and minHsNH2 have lower contribution in the model for the cellular uptake of ENMOs in the HUVEC cell line.
U937 cell line
We performed SHAP analysis regarding the U937 cell line, and the plot is shown in Figure 9. The details of descriptors definitions are explained in Supporting Information File 1, Table S4.
![[2190-4286-15-75-9]](/bjnano/content/figures/2190-4286-15-75-9.png?scale=2.0&max-width=1024&background=FFFFFF)
Figure 9: SHAP summary plot for the ML-based LDA model (training set) in the case of the U937 cell line.
Figure 9: SHAP summary plot for the ML-based LDA model (training set) in the case of the U937 cell line.
The descriptor SsNH2 is recognized as the most contributing feature in the developed model. In simple terms, the SsNH2 value indicates the summation value of the electronic state of a single-bonded NH2 group present in a compound [61]. Higher values of SsNH2 have a negative impact on the cellular uptake of ENMOs in the U937 cell line (e.g., 69, 71, and 80). The next, positively contributing, descriptor is SHsNH2, calculated as the sum of the atom-type E-state indices for all –NH2 hydrogens in a molecule [64]. The variable maxsNH2 makes a significant positive contribution to the model (Figure 9). The descriptor maxsNH2 refers to the maximum electronic state value for the single-bonded NH2 group present in a structure [53]. It is noticed in the cases of surface modifiers 77 and 86 that these structures are suitable for higher cellular uptake of ENMOs in the U937 cell line. The descriptor minHsNH2 exhibited a negative contribution to the final model output. The minHsNH2 descriptor refers to the minimum atom-type E-state indices for all of the amino (–NH2) hydrogens in a molecule [52]. It is observed that the surface modifiers 94 and 98, which have a higher value of the minHsNH2 descriptor, are not suitable as structural modifiers of ENMOs for the higher cellular uptake in the U937 cell line. The descriptor ETA_dEpsilon_D [65] signifies that surface modifiers containing a higher number of strongly electronegative atoms (such as N, O, and F) or hydrogen bond donor atoms will cause a lower uptake of ENMOs in the U937 cell line (e.g., 6, 9, and 15). Other descriptors including maxssO, maxHBd, maxdO, ndO, ndssC, and nHBDon_Lipinski contribute less to the cellular uptake of ENMOs in the U937 cell line.
Conclusion
Identifying the surface modifiers of engineered nanostructured metal oxides (ENMOs) that enhance affinity for certain cell types while reducing uptake by non-target cells could significantly improve the efficacy of targeted therapies and minimize off-target effects. In this study, classification-based machine learning models have been created separately using cellular uptake data from 109 surface modifiers of ENMOs in three cell lines, namely, PaCa2, HUVEC, and U937, for the identification of distinctive fingerprints/descriptors controlling the cellular uptake in the specific cell line. Significant uptake-promoting and uptake-impairing fingerprints were identified for different cell lines based on Bayesian classification studies. The best machine learning (ML) model for the PaCa2 cell line was the random forest (RF), which achieved fivefold cross-validated ROC values of 0.939 for the training set and 0.818 for the test set, indicating acceptable internal and external validation results. Similarly, the best-performing ML model for the HUVEC cell line was support vector classifier (SVC), which demonstrated fivefold cross-validated ROC values of 0.969 for the training set and 0.870 for the test set, indicating successful internal and external validation. Finally, the top ML model for the U937 cell line, linear discriminant analysis (LDA), yielded fivefold cross-validated ROC values of 0.735 for the training set and 0.630 for the test set. The findings revealed distinctive structural fingerprints associated with the cellular uptake of nanoparticles in each cell line (Figure 10). For example, the presence of a hydroxy group in the structures of the surface modifiers leads to a decrease in the cellular uptake of ENMOs in the PaCa2 cell line only. Furthermore, the study also identifies some common structural fingerprints among surface modifiers (Supporting Information File 1, Figures S7–S8) observed in uptake across multiple cell lines. It is observed from SHAP analysis that there are three major descriptors (maxsNH2, maxHBd, and maxssO) identified as common in the three best ML models developed for the three different cell lines. Having one or more aliphatic primary amino groups (descriptor maxsNH2) in the surface modifiers leads to reduced cellular uptake of ENMOs in both PaCa2 and HUVEC cell lines. Neither does a higher number of hydrogen bond donating groups (descriptor maxHBd) in the surface modifiers promote greater cellular uptake of ENMOs in these cell lines. Additionally, the study highlights that the presence of ether-type oxygen (descriptor maxssO) in the surface modifier structure may contribute to increased cellular uptake across the three cell lines. The structural fingerprints/descriptors obtained from the current modelling study will be helpful to scientists for the future design of surface modifiers of nanostructured metal oxides. This may facilitate a higher therapeutic response by surface modifier-mediated site-specific targeting to the cell surface receptors of particular cell types. Further availability of sufficient and reliable uptake data of ENMOs in other cell types is also needed for better confirmation of these fingerprints/descriptors in the design of surface modifiers of ENMOs.
![[2190-4286-15-75-10]](/bjnano/content/figures/2190-4286-15-75-10.png?scale=2.0&max-width=1024&background=FFFFFF)
Figure 10: Summary of structural features of surface modifiers of ENMOs for the uptake in the PaCa2, HUVEC, and U937 cell line models.
Figure 10: Summary of structural features of surface modifiers of ENMOs for the uptake in the PaCa2, HUVEC, an...
Supporting Information
| Supporting Information File 1: Additional figures and tables. | ||
| Format: PDF | Size: 1.2 MB | Download |
Acknowledgements
The authors thank Ms. Samima Khatun for her help in initial writing of the manuscript. We thankfully acknowledge Prof. Tarun Jha of Jadavpur University, India, for his continuous motivation and for providing the facilities to use Discovery Studio 3.0 (DS 3.0). Research facilities of the Department of Pharmaceutical Technology, Jadavpur University are also acknowledged.
Data Availability Statement
All data that supports the findings of this study is available in the published article and/or the supporting information to this article.
References
-
Chavali, M. S.; Nikolova, M. P. SN Appl. Sci. 2019, 1, 607. doi:10.1007/s42452-019-0592-3
Return to citation in text: [1] -
Joshi, N.; Pandey, D. K.; Mistry, B. G.; Singh, D. K. Metal Oxide Nanoparticles: Synthesis, Properties, Characterization, and Applications. Nanomaterials; Springer Nature Singapore: Singapore, 2023; pp 103–144. doi:10.1007/978-981-19-7963-7_5
Return to citation in text: [1] -
Mukherjee, K.; Acharya, K. Arch. Environ. Contam. Toxicol. 2018, 75, 175–186. doi:10.1007/s00244-018-0519-9
Return to citation in text: [1] -
He, X.; Aker, W. G.; Fu, P. P.; Hwang, H.-M. Environ. Sci.: Nano 2015, 2, 564–582. doi:10.1039/c5en00094g
Return to citation in text: [1] -
Mujahid, M. H.; Upadhyay, T. K.; Khan, F.; Pandey, P.; Park, M. N.; Sharangi, A. B.; Saeed, M.; Upadhye, V. J.; Kim, B. Biomed. Pharmacother. 2022, 155, 113791. doi:10.1016/j.biopha.2022.113791
Return to citation in text: [1] -
Bhateria, R.; Singh, R. J. Water Process Eng. 2019, 31, 100845. doi:10.1016/j.jwpe.2019.100845
Return to citation in text: [1] -
Salem, S. S.; Hammad, E. N.; Mohamed, A. A.; El-Dougdoug, W. Biointerface Res. Appl. Chem. 2023, 13 (1), 41. doi:10.33263/briac131.041
Return to citation in text: [1] -
Nunes, D.; Pimentel, A.; Santos, L.; Barquinha, P.; Pereira, L.; Fortunato, E.; Martins, R. Electronic applications of oxide nanostructures; Metal Oxide Nanostructures; Elsevier: Amsterdam, Netherlands, 2019; pp 149–197. doi:10.1016/b978-0-12-811512-1.00005-9
Return to citation in text: [1] -
Sajid, M.; Ilyas, M.; Basheer, C.; Tariq, M.; Daud, M.; Baig, N.; Shehzad, F. Environ. Sci. Pollut. Res. 2015, 22, 4122–4143. doi:10.1007/s11356-014-3994-1
Return to citation in text: [1] -
Roy, S.; Sarkhel, S.; Bisht, D.; Hanumantharao, S. N.; Rao, S.; Jaiswal, A. Biomater. Sci. 2022, 10, 4392–4423. doi:10.1039/d2bm00472k
Return to citation in text: [1] -
Hu, B.; Liu, R.; Liu, Q.; Lin, Z.; Shi, Y.; Li, J.; Wang, L.; Li, L.; Xiao, X.; Wu, Y. J. Mater. Chem. B 2022, 10, 2357–2383. doi:10.1039/d1tb02549j
Return to citation in text: [1] -
Aliyandi, A.; Zuhorn, I. S.; Salvati, A. Front. Bioeng. Biotechnol. 2020, 8, 599454. doi:10.3389/fbioe.2020.599454
Return to citation in text: [1] -
Behzadi, S.; Serpooshan, V.; Tao, W.; Hamaly, M. A.; Alkawareek, M. Y.; Dreaden, E. C.; Brown, D.; Alkilany, A. M.; Farokhzad, O. C.; Mahmoudi, M. Chem. Soc. Rev. 2017, 46, 4218–4244. doi:10.1039/c6cs00636a
Return to citation in text: [1] -
Sadiq, I. Z. Curr. Mol. Med. 2023, 23, 13–35. doi:10.2174/1566524022666211222161637
Return to citation in text: [1] -
Navarro-Yepes, J.; Burns, M.; Anandhan, A.; Khalimonchuk, O.; del Razo, L. M.; Quintanilla-Vega, B.; Pappa, A.; Panayiotidis, M. I.; Franco, R. Antioxid. Redox Signaling 2014, 21, 66–85. doi:10.1089/ars.2014.5837
Return to citation in text: [1] -
Xia, H.; Tong, R.; Song, Y.; Xiong, F.; Li, J.; Wang, S.; Fu, H.; Wen, J.; Li, D.; Zeng, Y.; Zhao, Z.; Wu, J. J. Nanopart. Res. 2017, 19, 149. doi:10.1007/s11051-017-3833-7
Return to citation in text: [1] -
Das, P.; Ganguly, S.; Margel, S.; Gedanken, A. Nanoscale Adv. 2021, 3, 6762–6796. doi:10.1039/d1na00447f
Return to citation in text: [1] -
Roy, D.; Modi, A.; Ghosh, R.; Benito-León, J. Drug delivery and functional nanoparticles. In Antiviral and Antimicrobial Coatings Based on Functionalized Nanomaterials; ul Islam, S.; Hussain, C. M.; Shukla, S. K., Eds.; Elsevier: Amsterdam, Netherlands, 2023; pp 447–484. doi:10.1016/b978-0-323-91783-4.00018-8
Return to citation in text: [1] -
Kumar, V.; Kukkar, D.; Hashemi, B.; Kim, K. H.; Deep, A. Adv. Funct. Mater. 2019, 29, 1807859. doi:10.1002/adfm.201807859
Return to citation in text: [1] -
Kumar, A.; Voet, A.; Zhang, K. Y. J. Curr. Med. Chem. 2012, 19, 5128–5147. doi:10.2174/092986712803530467
Return to citation in text: [1] -
Ding, H.-m.; Ma, Y.-q. Small 2015, 11, 1055–1071. doi:10.1002/smll.201401943
Return to citation in text: [1] -
Fourches, D.; Pu, D.; Tassa, C.; Weissleder, R.; Shaw, S. Y.; Mumper, R. J.; Tropsha, A. ACS Nano 2010, 4, 5703–5712. doi:10.1021/nn1013484
Return to citation in text: [1] [2] -
Ghorbanzadeh, M.; Fatemi, M. H.; Karimpour, M. Ind. Eng. Chem. Res. 2012, 51, 10712–10718. doi:10.1021/ie3006947
Return to citation in text: [1] [2] -
Epa, V. C.; Burden, F. R.; Tassa, C.; Weissleder, R.; Shaw, S.; Winkler, D. A. Nano Lett. 2012, 12, 5808–5812. doi:10.1021/nl303144k
Return to citation in text: [1] [2] -
Toropov, A. A.; Toropova, A. P.; Puzyn, T.; Benfenati, E.; Gini, G.; Leszczynska, D.; Leszczynski, J. Chemosphere 2013, 92, 31–37. doi:10.1016/j.chemosphere.2013.03.012
Return to citation in text: [1] [2] -
Singh, K. P.; Gupta, S. RSC Adv. 2014, 4, 13215–13230. doi:10.1039/c4ra01274g
Return to citation in text: [1] [2] [3] -
Kar, S.; Gajewicz, A.; Puzyn, T.; Roy, K. Toxicol. In Vitro 2014, 28, 600–606. doi:10.1016/j.tiv.2013.12.018
Return to citation in text: [1] [2] -
Winkler, D. A.; Burden, F. R.; Yan, B.; Weissleder, R.; Tassa, C.; Shaw, S.; Epa, V. C. SAR QSAR Environ. Res. 2014, 25, 161–172. doi:10.1080/1062936x.2013.874367
Return to citation in text: [1] -
Basant, N.; Gupta, S. Nanotoxicology 2017, 11, 20–30. doi:10.1080/17435390.2016.1257075
Return to citation in text: [1] -
Luan, F.; Tang, L.; Zhang, L.; Zhang, S.; Monteagudo, M. C.; Cordeiro, M. N. D. S. Food Chem. Toxicol. 2018, 112, 571–580. doi:10.1016/j.fct.2017.04.010
Return to citation in text: [1] -
Ojha, P. K.; Kar, S.; Roy, K.; Leszczynski, J. Nanotoxicology 2019, 13, 14–34. doi:10.1080/17435390.2018.1529836
Return to citation in text: [1] -
Qi, R.; Pan, Y.; Cao, J.; Jia, Z.; Jiang, J. Chemosphere 2020, 249, 126175. doi:10.1016/j.chemosphere.2020.126175
Return to citation in text: [1] -
Shi, H.; Pan, Y.; Yang, F.; Cao, J.; Tan, X.; Yuan, B.; Jiang, J. Molecules 2021, 26, 2188. doi:10.3390/molecules26082188
Return to citation in text: [1] -
Weissleder, R.; Kelly, K.; Sun, E. Y.; Shtatland, T.; Josephson, L. Nat. Biotechnol. 2005, 23, 1418–1423. doi:10.1038/nbt1159
Return to citation in text: [1] -
Discovery Studio 3.0, (DS 3.0); Accelrys Inc.: San Diego, USA, 2015.
Return to citation in text: [1] [2] -
Sardar, S.; Jyotisha; Amin, S. A.; Khatun, S.; Qureshi, I. A.; Patil, U. K.; Jha, T.; Gayen, S. J. Biomol. Struct. Dyn. 2024, 42, 5642–5656. doi:10.1080/07391102.2023.2227710
Return to citation in text: [1] -
Rogers, D.; Hahn, M. J. Chem. Inf. Model. 2010, 50, 742–754. doi:10.1021/ci100050t
Return to citation in text: [1] -
Amin, S. A.; Kumar, J.; Khatun, S.; Das, S.; Qureshi, I. A.; Jha, T.; Gayen, S. J. Mol. Struct. 2022, 1260, 132833. doi:10.1016/j.molstruc.2022.132833
Return to citation in text: [1] -
Khatun, S.; Amin, S. A.; Banerjee, S.; Gayen, S.; Jha, T. Modeling Inhibitors of Gelatinases; Modeling Inhibitors of Matrix Metalloproteinases; CRC Press: Boca Raton, FL, U.S.A., 2023; pp 368–398. doi:10.1201/9781003303282-14
Return to citation in text: [1] -
Das, T.; Bhattacharya, A.; Jha, T.; Gayen, S. Curr. Comput.-Aided Drug Des. 2024, in press. doi:10.2174/0115734099282303240126061624
Return to citation in text: [1] -
Jain, S.; Bhardwaj, B.; Amin, S. A.; Adhikari, N.; Jha, T.; Gayen, S. J. Biomol. Struct. Dyn. 2019, 38, 1683–1696. doi:10.1080/07391102.2019.1615000
Return to citation in text: [1] -
Sardar, S.; Bhattacharya, A.; Amin, S. A.; Jha, T.; Gayen, S. Mol. Diversity 2023, 10670. doi:10.1007/s11030-023-10670-2
Return to citation in text: [1] -
Yap, C. W. J. Comput. Chem. 2011, 32, 1466–1474. doi:10.1002/jcc.21707
Return to citation in text: [1] -
Ambure, P.; Aher, R. B.; Gajewicz, A.; Puzyn, T.; Roy, K. Chemom. Intell. Lab. Syst. 2015, 147, 1–13. doi:10.1016/j.chemolab.2015.07.007
Return to citation in text: [1] -
Banerjee, A.; Roy, K. Chemom. Intell. Lab. Syst. 2023, 237, 104829. doi:10.1016/j.chemolab.2023.104829
Return to citation in text: [1] -
Nandy, A.; Kar, S.; Roy, K. Mol. Simul. 2014, 40, 261–274. doi:10.1080/08927022.2013.801076
Return to citation in text: [1] -
Pandey, S. K.; Roy, K. Toxicology 2023, 500, 153676. doi:10.1016/j.tox.2023.153676
Return to citation in text: [1] -
Banerjee, A.; Kar, S.; Pore, S.; Roy, K. Nanotoxicology 2023, 17, 78–93. doi:10.1080/17435390.2023.2186280
Return to citation in text: [1] -
Gramatica, P. QSAR Comb. Sci. 2007, 26, 694–701. doi:10.1002/qsar.200610151
Return to citation in text: [1] -
Yu, T.-H.; Su, B.-H.; Battalora, L. C.; Liu, S.; Tseng, Y. J. Briefings Bioinf. 2022, 23, bbab377. doi:10.1093/bib/bbab377
Return to citation in text: [1] -
Adawara, S. N.; Shallangwa, G. A.; Mamza, P. A.; Abdulkadir, I. J. Chem. Lett. 2022, 3, 46–56. doi:10.22034/jchemlett.2022.336894.1065
Return to citation in text: [1] -
Xia, L.-Y.; Wang, Y.-W.; Meng, D.-Y.; Yao, X.-J.; Chai, H.; Liang, Y. Int. J. Mol. Sci. 2018, 19, 30. doi:10.3390/ijms19010030
Return to citation in text: [1] [2] -
Hammann, F.; Schöning, V.; Drewe, J. J. Appl. Toxicol. 2019, 39, 412–419. doi:10.1002/jat.3741
Return to citation in text: [1] [2] [3] -
Przybyłek, M. Molecules 2020, 25, 5942. doi:10.3390/molecules25245942
Return to citation in text: [1] -
Idris, M. O.; Abechi, S. E.; Shallangwa, G. A. Future J. Pharm. Sci. 2021, 7, 167. doi:10.1186/s43094-021-00315-2
Return to citation in text: [1] [2] -
Wan, Z.; Wang, Q.-D. Chem. Phys. Lett. 2020, 747, 137327. doi:10.1016/j.cplett.2020.137327
Return to citation in text: [1] -
Papa, E.; Sangion, A.; Arnot, J. A.; Gramatica, P. Food Chem. Toxicol. 2018, 112, 535–543. doi:10.1016/j.fct.2017.04.016
Return to citation in text: [1] -
De, P.; Kumar, V.; Kar, S.; Roy, K.; Leszczynski, J. Struct. Chem. 2022, 33, 1741–1753. doi:10.1007/s11224-022-01975-3
Return to citation in text: [1] [2] -
Banerjee, A.; Roy, K. Mol. Diversity 2022, 26, 2847–2862. doi:10.1007/s11030-022-10478-6
Return to citation in text: [1] -
Li, Y.; Fan, T.; Ren, T.; Zhang, N.; Zhao, L.; Zhong, R.; Sun, G. Green Chem. 2024, 26, 839–856. doi:10.1039/d3gc03109h
Return to citation in text: [1] -
Yu, X.; Acree, W. E., Jr. J. Mol. Liq. 2023, 376, 121455. doi:10.1016/j.molliq.2023.121455
Return to citation in text: [1] [2] -
Bitam, S.; Hamadache, M.; Hanini, S. SAR QSAR Environ. Res. 2018, 29, 213–230. doi:10.1080/1062936x.2018.1423640
Return to citation in text: [1] -
Roy, K.; Kabir, H. Chem. Eng. Sci. 2012, 73, 86–98. doi:10.1016/j.ces.2012.01.005
Return to citation in text: [1] -
Jezierska, A.; Vračko, M.; Basak, S. C. Mol. Diversity 2004, 8, 371–377. doi:10.1023/b:modi.0000047502.66802.3d
Return to citation in text: [1] -
De, P.; Roy, K. SAR QSAR Environ. Res. 2018, 29, 319–337. doi:10.1080/1062936x.2018.1436086
Return to citation in text: [1]
| 36. | Sardar, S.; Jyotisha; Amin, S. A.; Khatun, S.; Qureshi, I. A.; Patil, U. K.; Jha, T.; Gayen, S. J. Biomol. Struct. Dyn. 2024, 42, 5642–5656. doi:10.1080/07391102.2023.2227710 |
| 46. | Nandy, A.; Kar, S.; Roy, K. Mol. Simul. 2014, 40, 261–274. doi:10.1080/08927022.2013.801076 |
| 47. | Pandey, S. K.; Roy, K. Toxicology 2023, 500, 153676. doi:10.1016/j.tox.2023.153676 |
| 44. | Ambure, P.; Aher, R. B.; Gajewicz, A.; Puzyn, T.; Roy, K. Chemom. Intell. Lab. Syst. 2015, 147, 1–13. doi:10.1016/j.chemolab.2015.07.007 |
| 45. | Banerjee, A.; Roy, K. Chemom. Intell. Lab. Syst. 2023, 237, 104829. doi:10.1016/j.chemolab.2023.104829 |
| 40. | Das, T.; Bhattacharya, A.; Jha, T.; Gayen, S. Curr. Comput.-Aided Drug Des. 2024, in press. doi:10.2174/0115734099282303240126061624 |
| 41. | Jain, S.; Bhardwaj, B.; Amin, S. A.; Adhikari, N.; Jha, T.; Gayen, S. J. Biomol. Struct. Dyn. 2019, 38, 1683–1696. doi:10.1080/07391102.2019.1615000 |
| 42. | Sardar, S.; Bhattacharya, A.; Amin, S. A.; Jha, T.; Gayen, S. Mol. Diversity 2023, 10670. doi:10.1007/s11030-023-10670-2 |
| 37. | Rogers, D.; Hahn, M. J. Chem. Inf. Model. 2010, 50, 742–754. doi:10.1021/ci100050t |
| 38. | Amin, S. A.; Kumar, J.; Khatun, S.; Das, S.; Qureshi, I. A.; Jha, T.; Gayen, S. J. Mol. Struct. 2022, 1260, 132833. doi:10.1016/j.molstruc.2022.132833 |
| 39. | Khatun, S.; Amin, S. A.; Banerjee, S.; Gayen, S.; Jha, T. Modeling Inhibitors of Gelatinases; Modeling Inhibitors of Matrix Metalloproteinases; CRC Press: Boca Raton, FL, U.S.A., 2023; pp 368–398. doi:10.1201/9781003303282-14 |
| 48. | Banerjee, A.; Kar, S.; Pore, S.; Roy, K. Nanotoxicology 2023, 17, 78–93. doi:10.1080/17435390.2023.2186280 |
| 50. | Yu, T.-H.; Su, B.-H.; Battalora, L. C.; Liu, S.; Tseng, Y. J. Briefings Bioinf. 2022, 23, bbab377. doi:10.1093/bib/bbab377 |
| 57. | Papa, E.; Sangion, A.; Arnot, J. A.; Gramatica, P. Food Chem. Toxicol. 2018, 112, 535–543. doi:10.1016/j.fct.2017.04.016 |
| 58. | De, P.; Kumar, V.; Kar, S.; Roy, K.; Leszczynski, J. Struct. Chem. 2022, 33, 1741–1753. doi:10.1007/s11224-022-01975-3 |
| 55. | Idris, M. O.; Abechi, S. E.; Shallangwa, G. A. Future J. Pharm. Sci. 2021, 7, 167. doi:10.1186/s43094-021-00315-2 |
| 56. | Wan, Z.; Wang, Q.-D. Chem. Phys. Lett. 2020, 747, 137327. doi:10.1016/j.cplett.2020.137327 |
| 53. | Hammann, F.; Schöning, V.; Drewe, J. J. Appl. Toxicol. 2019, 39, 412–419. doi:10.1002/jat.3741 |
| 51. | Adawara, S. N.; Shallangwa, G. A.; Mamza, P. A.; Abdulkadir, I. J. Chem. Lett. 2022, 3, 46–56. doi:10.22034/jchemlett.2022.336894.1065 |
| 52. | Xia, L.-Y.; Wang, Y.-W.; Meng, D.-Y.; Yao, X.-J.; Chai, H.; Liang, Y. Int. J. Mol. Sci. 2018, 19, 30. doi:10.3390/ijms19010030 |
| 60. | Li, Y.; Fan, T.; Ren, T.; Zhang, N.; Zhao, L.; Zhong, R.; Sun, G. Green Chem. 2024, 26, 839–856. doi:10.1039/d3gc03109h |
| 55. | Idris, M. O.; Abechi, S. E.; Shallangwa, G. A. Future J. Pharm. Sci. 2021, 7, 167. doi:10.1186/s43094-021-00315-2 |
| 59. | Banerjee, A.; Roy, K. Mol. Diversity 2022, 26, 2847–2862. doi:10.1007/s11030-022-10478-6 |
| 1. | Chavali, M. S.; Nikolova, M. P. SN Appl. Sci. 2019, 1, 607. doi:10.1007/s42452-019-0592-3 |
| 7. | Salem, S. S.; Hammad, E. N.; Mohamed, A. A.; El-Dougdoug, W. Biointerface Res. Appl. Chem. 2023, 13 (1), 41. doi:10.33263/briac131.041 |
| 8. | Nunes, D.; Pimentel, A.; Santos, L.; Barquinha, P.; Pereira, L.; Fortunato, E.; Martins, R. Electronic applications of oxide nanostructures; Metal Oxide Nanostructures; Elsevier: Amsterdam, Netherlands, 2019; pp 149–197. doi:10.1016/b978-0-12-811512-1.00005-9 |
| 23. | Ghorbanzadeh, M.; Fatemi, M. H.; Karimpour, M. Ind. Eng. Chem. Res. 2012, 51, 10712–10718. doi:10.1021/ie3006947 |
| 64. | Jezierska, A.; Vračko, M.; Basak, S. C. Mol. Diversity 2004, 8, 371–377. doi:10.1023/b:modi.0000047502.66802.3d |
| 5. | Mujahid, M. H.; Upadhyay, T. K.; Khan, F.; Pandey, P.; Park, M. N.; Sharangi, A. B.; Saeed, M.; Upadhye, V. J.; Kim, B. Biomed. Pharmacother. 2022, 155, 113791. doi:10.1016/j.biopha.2022.113791 |
| 6. | Bhateria, R.; Singh, R. J. Water Process Eng. 2019, 31, 100845. doi:10.1016/j.jwpe.2019.100845 |
| 24. | Epa, V. C.; Burden, F. R.; Tassa, C.; Weissleder, R.; Shaw, S.; Winkler, D. A. Nano Lett. 2012, 12, 5808–5812. doi:10.1021/nl303144k |
| 3. | Mukherjee, K.; Acharya, K. Arch. Environ. Contam. Toxicol. 2018, 75, 175–186. doi:10.1007/s00244-018-0519-9 |
| 4. | He, X.; Aker, W. G.; Fu, P. P.; Hwang, H.-M. Environ. Sci.: Nano 2015, 2, 564–582. doi:10.1039/c5en00094g |
| 22. | Fourches, D.; Pu, D.; Tassa, C.; Weissleder, R.; Shaw, S. Y.; Mumper, R. J.; Tropsha, A. ACS Nano 2010, 4, 5703–5712. doi:10.1021/nn1013484 |
| 23. | Ghorbanzadeh, M.; Fatemi, M. H.; Karimpour, M. Ind. Eng. Chem. Res. 2012, 51, 10712–10718. doi:10.1021/ie3006947 |
| 24. | Epa, V. C.; Burden, F. R.; Tassa, C.; Weissleder, R.; Shaw, S.; Winkler, D. A. Nano Lett. 2012, 12, 5808–5812. doi:10.1021/nl303144k |
| 25. | Toropov, A. A.; Toropova, A. P.; Puzyn, T.; Benfenati, E.; Gini, G.; Leszczynska, D.; Leszczynski, J. Chemosphere 2013, 92, 31–37. doi:10.1016/j.chemosphere.2013.03.012 |
| 26. | Singh, K. P.; Gupta, S. RSC Adv. 2014, 4, 13215–13230. doi:10.1039/c4ra01274g |
| 27. | Kar, S.; Gajewicz, A.; Puzyn, T.; Roy, K. Toxicol. In Vitro 2014, 28, 600–606. doi:10.1016/j.tiv.2013.12.018 |
| 63. | Roy, K.; Kabir, H. Chem. Eng. Sci. 2012, 73, 86–98. doi:10.1016/j.ces.2012.01.005 |
| 2. | Joshi, N.; Pandey, D. K.; Mistry, B. G.; Singh, D. K. Metal Oxide Nanoparticles: Synthesis, Properties, Characterization, and Applications. Nanomaterials; Springer Nature Singapore: Singapore, 2023; pp 103–144. doi:10.1007/978-981-19-7963-7_5 |
| 22. | Fourches, D.; Pu, D.; Tassa, C.; Weissleder, R.; Shaw, S. Y.; Mumper, R. J.; Tropsha, A. ACS Nano 2010, 4, 5703–5712. doi:10.1021/nn1013484 |
| 61. | Yu, X.; Acree, W. E., Jr. J. Mol. Liq. 2023, 376, 121455. doi:10.1016/j.molliq.2023.121455 |
| 13. | Behzadi, S.; Serpooshan, V.; Tao, W.; Hamaly, M. A.; Alkawareek, M. Y.; Dreaden, E. C.; Brown, D.; Alkilany, A. M.; Farokhzad, O. C.; Mahmoudi, M. Chem. Soc. Rev. 2017, 46, 4218–4244. doi:10.1039/c6cs00636a |
| 14. | Sadiq, I. Z. Curr. Mol. Med. 2023, 23, 13–35. doi:10.2174/1566524022666211222161637 |
| 15. | Navarro-Yepes, J.; Burns, M.; Anandhan, A.; Khalimonchuk, O.; del Razo, L. M.; Quintanilla-Vega, B.; Pappa, A.; Panayiotidis, M. I.; Franco, R. Antioxid. Redox Signaling 2014, 21, 66–85. doi:10.1089/ars.2014.5837 |
| 18. | Roy, D.; Modi, A.; Ghosh, R.; Benito-León, J. Drug delivery and functional nanoparticles. In Antiviral and Antimicrobial Coatings Based on Functionalized Nanomaterials; ul Islam, S.; Hussain, C. M.; Shukla, S. K., Eds.; Elsevier: Amsterdam, Netherlands, 2023; pp 447–484. doi:10.1016/b978-0-323-91783-4.00018-8 |
| 53. | Hammann, F.; Schöning, V.; Drewe, J. J. Appl. Toxicol. 2019, 39, 412–419. doi:10.1002/jat.3741 |
| 12. | Aliyandi, A.; Zuhorn, I. S.; Salvati, A. Front. Bioeng. Biotechnol. 2020, 8, 599454. doi:10.3389/fbioe.2020.599454 |
| 19. | Kumar, V.; Kukkar, D.; Hashemi, B.; Kim, K. H.; Deep, A. Adv. Funct. Mater. 2019, 29, 1807859. doi:10.1002/adfm.201807859 |
| 20. | Kumar, A.; Voet, A.; Zhang, K. Y. J. Curr. Med. Chem. 2012, 19, 5128–5147. doi:10.2174/092986712803530467 |
| 21. | Ding, H.-m.; Ma, Y.-q. Small 2015, 11, 1055–1071. doi:10.1002/smll.201401943 |
| 62. | Bitam, S.; Hamadache, M.; Hanini, S. SAR QSAR Environ. Res. 2018, 29, 213–230. doi:10.1080/1062936x.2018.1423640 |
| 10. | Roy, S.; Sarkhel, S.; Bisht, D.; Hanumantharao, S. N.; Rao, S.; Jaiswal, A. Biomater. Sci. 2022, 10, 4392–4423. doi:10.1039/d2bm00472k |
| 11. | Hu, B.; Liu, R.; Liu, Q.; Lin, Z.; Shi, Y.; Li, J.; Wang, L.; Li, L.; Xiao, X.; Wu, Y. J. Mater. Chem. B 2022, 10, 2357–2383. doi:10.1039/d1tb02549j |
| 61. | Yu, X.; Acree, W. E., Jr. J. Mol. Liq. 2023, 376, 121455. doi:10.1016/j.molliq.2023.121455 |
| 9. | Sajid, M.; Ilyas, M.; Basheer, C.; Tariq, M.; Daud, M.; Baig, N.; Shehzad, F. Environ. Sci. Pollut. Res. 2015, 22, 4122–4143. doi:10.1007/s11356-014-3994-1 |
| 16. | Xia, H.; Tong, R.; Song, Y.; Xiong, F.; Li, J.; Wang, S.; Fu, H.; Wen, J.; Li, D.; Zeng, Y.; Zhao, Z.; Wu, J. J. Nanopart. Res. 2017, 19, 149. doi:10.1007/s11051-017-3833-7 |
| 17. | Das, P.; Ganguly, S.; Margel, S.; Gedanken, A. Nanoscale Adv. 2021, 3, 6762–6796. doi:10.1039/d1na00447f |
| 58. | De, P.; Kumar, V.; Kar, S.; Roy, K.; Leszczynski, J. Struct. Chem. 2022, 33, 1741–1753. doi:10.1007/s11224-022-01975-3 |
| 27. | Kar, S.; Gajewicz, A.; Puzyn, T.; Roy, K. Toxicol. In Vitro 2014, 28, 600–606. doi:10.1016/j.tiv.2013.12.018 |
| 25. | Toropov, A. A.; Toropova, A. P.; Puzyn, T.; Benfenati, E.; Gini, G.; Leszczynska, D.; Leszczynski, J. Chemosphere 2013, 92, 31–37. doi:10.1016/j.chemosphere.2013.03.012 |
| 26. | Singh, K. P.; Gupta, S. RSC Adv. 2014, 4, 13215–13230. doi:10.1039/c4ra01274g |
| 65. | De, P.; Roy, K. SAR QSAR Environ. Res. 2018, 29, 319–337. doi:10.1080/1062936x.2018.1436086 |
| 53. | Hammann, F.; Schöning, V.; Drewe, J. J. Appl. Toxicol. 2019, 39, 412–419. doi:10.1002/jat.3741 |
| 52. | Xia, L.-Y.; Wang, Y.-W.; Meng, D.-Y.; Yao, X.-J.; Chai, H.; Liang, Y. Int. J. Mol. Sci. 2018, 19, 30. doi:10.3390/ijms19010030 |
| 33. | Shi, H.; Pan, Y.; Yang, F.; Cao, J.; Tan, X.; Yuan, B.; Jiang, J. Molecules 2021, 26, 2188. doi:10.3390/molecules26082188 |
| 34. | Weissleder, R.; Kelly, K.; Sun, E. Y.; Shtatland, T.; Josephson, L. Nat. Biotechnol. 2005, 23, 1418–1423. doi:10.1038/nbt1159 |
| 32. | Qi, R.; Pan, Y.; Cao, J.; Jia, Z.; Jiang, J. Chemosphere 2020, 249, 126175. doi:10.1016/j.chemosphere.2020.126175 |
| 26. | Singh, K. P.; Gupta, S. RSC Adv. 2014, 4, 13215–13230. doi:10.1039/c4ra01274g |
| 30. | Luan, F.; Tang, L.; Zhang, L.; Zhang, S.; Monteagudo, M. C.; Cordeiro, M. N. D. S. Food Chem. Toxicol. 2018, 112, 571–580. doi:10.1016/j.fct.2017.04.010 |
| 31. | Ojha, P. K.; Kar, S.; Roy, K.; Leszczynski, J. Nanotoxicology 2019, 13, 14–34. doi:10.1080/17435390.2018.1529836 |
| 28. | Winkler, D. A.; Burden, F. R.; Yan, B.; Weissleder, R.; Tassa, C.; Shaw, S.; Epa, V. C. SAR QSAR Environ. Res. 2014, 25, 161–172. doi:10.1080/1062936x.2013.874367 |
| 29. | Basant, N.; Gupta, S. Nanotoxicology 2017, 11, 20–30. doi:10.1080/17435390.2016.1257075 |
© 2024 Dasgupta et al.; licensee Beilstein-Institut.
This is an open access article licensed under the terms of the Beilstein-Institut Open Access License Agreement (https://www.beilstein-journals.org/bjnano/terms), which is identical to the Creative Commons Attribution 4.0 International License (https://creativecommons.org/licenses/by/4.0). The reuse of material under this license requires that the author(s), source and license are credited. Third-party material in this article could be subject to other licenses (typically indicated in the credit line), and in this case, users are required to obtain permission from the license holder to reuse the material.