Associate Editor: T. Glatzel Beilstein J. Nanotechnol.2025,16, 944–950.https://doi.org/10.3762/bjnano.16.72 Received 13 Mar 2025,
Accepted 03 Jun 2025,
Published 26 Jun 2025
We investigate the impact of tip changes on atomic-scale non-contact atomic force microscopy (NC-AFM) contrast formation when imaging a CaF2(111) surface. A change of the atomic contrast is explained by a polarity change of the tip-terminating cluster or by a polarity-preserving tip change via the re-arrangement of the foremost atoms. Based on the established understanding of the unique contrast patterns on CaF2(111), polarity-preserving and polarity-changing tip changes can be identified unambiguously. From analyzing a large set of images, we find that the vast majority of tip changes tend to result in negative tip termination. This analysis delivers hints for tip configurations suitable for stable imaging of CaF2(111) surfaces.
Non-contact atomic force microscopy (NC-AFM) [1] is a surface science tool that has been used to atomically resolve surfaces of semiconductor and insulator materials in real space with unprecedented spatial resolution [2-6]. Besides high-resolution imaging of molecular structures [7], NC-AFM has demonstrated its ability to identify sublattices of atomic surfaces [8-10]. In these studies, the knowledge of the tip’s atomic structure plays a vital role as the tip-terminating cluster uniquely interacts with the different surface atoms. At cryogenic temperatures, the use of functionalized tips such as as CO-terminated tips [6,11], Xe-terminated tips [12-14] and O-terminated Cu tips [15-17] has become the state-of-the-art for structure elucidation and identification of surface sites.
However, this approach is presently not feasible for measurements performed at room temperature as the required control over the tip termination is challenged by thermal motion. For room-temperature measurements, it is common practice to bring the tip apex in slight contact with the surface under investigation to form a tip cluster yielding atomic contrast [18]. As structure and chemical composition of the resulting tip-terminating cluster are not known, the understanding of contrast formation with non-functionalized tips has been developed over many years based on theoretical simulations of NC-AFM data for a variety of plausible tip models [9,19-22]. Through further endeavors, a qualitative distance-dependent approach involving electrostatic interactions and Pauli repulsion has recently been exemplified on CaF2(111) [10]. As a central result, gradual atomic contrast transitions as a function of the tip–sample distance have been introduced as criteria for identifying a positively and a negatively terminated tip [10]. Still, a crucial aspect in sublattice identification studies is to distinguish between contrast changes caused by a change of the tip-terminating cluster (i.e., a tip change) and a distance-dependent contrast evolution for a stable tip. Tip changes are inevitable in NC-AFM experiments with non-functionalized tips, especially as commonly used silicon tips are very reactive and readily pick up various entities. This particularly concerns the transfer of surface species to the tip when the tip is subject to intentional or unintentional contact with the surface. Furthermore, ambient species like native oxides, hydrogen ions, or residual water can adsorb on the tip apex during scanning. Additionally, the foremost tip atom may rearrange to minimize the tip surface energy in response to increasing tip–sample interaction forces.
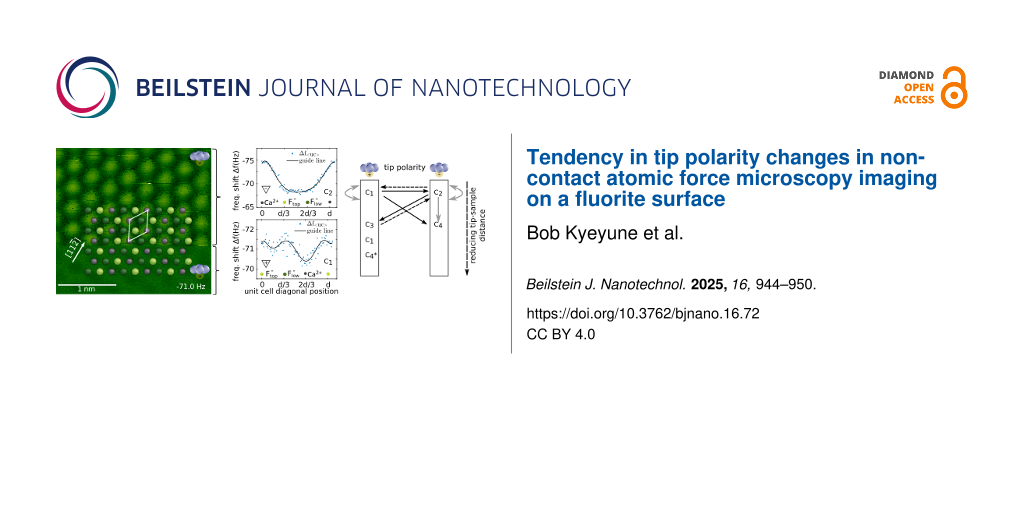
Here, we perform an experimental investigation of tip changes during NC-AFM imaging of a CaF2(111) surface with non-functionalized tips at both room temperature (RT) and low temperature (LT). We identify atomic contrast changes resulting either from a polarity change of the tip-terminating cluster or from a polarity-preserving tip change. Following the recently developed model for contrast formation on CaF2(111) surfaces [10], we adopt the contrast mode notations C1, C3, and C4* for a positively terminated tip and C2 and C4 for a negatively terminated tip. The distance-dependent contrast evolution [10] is summarized along the vertical columns in Figure 1. This figure additionally includes markers for tip changes as demonstrated in this work: Black solid arrows mark contrast changes exhibiting a change in tip polarity demonstrated in this work, while polarity-preserving tip changes are indicated by grey arrows. In addition, dashed arrows denote polarity changing tip changes that were observed during our experiments but are not discussed in the following as they represent the reverse direction of presented cases.
Figure 1:
Distance-dependent contrast formation on CaF2(111) for positively and negatively terminated tips (vertical columns) as well as transitions between contrast modes due to tip changes. The contrast modes C1, C3, and C4* (C2 and C4) are assigned to a positive (negative) tip termination [10]. Solid black arrows indicate experimentally observed changes of the tip polarity, while grey arrows denote polarity-preserving tip changes. Dashed black arrows indicate tip changes that were observed but are excluded from the discussion herein.
Figure 1:
Distance-dependent contrast formation on CaF2(111) for positively and negatively terminated tips (v...
The contrast modes C4 or C4* are cyclic members of the same contrast mode, as introduced in [10]. Consequently, the assignment of NC-AFM image data to these contrasts modes requires the acquisition of systematic distance-dependent measurements [10]. Without such distance-dependent data, the contrast mode assignment is questionable.
Experimental
RT experiments were performed on a bulk CaF2 crystal after preparing a clean CaF2(111) surface by cleaving the crystal in ultra-high vacuum (UHV) [23]. For the LT experiments, a CaF2/CaF/Si(111) thin film sample was used. The sample was prepared in situ by first degassing a p-type Si (B-doped) sample (Institute of Electronic Materials Technology, Warsaw, Poland) for several hours after introduction into the vacuum. Second, the Si(111)-(7 × 7) termination was formed by flash annealing cycles. Third, CaF2 material (99.9% purity) was deposited on the Si(111)-(7 × 7) surface from an EFM3T e-beam sublimator (Focus GmbH, Huenstetten, Germany) at substrates temperatures of 550 °C. Under these conditions, a CaF interface layer is formed, which removes the Si (7 × 7) reconstruction and allows for growing multilayers of well-ordered CaF2(111) [24,25], see [26] for further preparation details.
RT experiments were performed with a UHV 750 AFM system (RHK, Troy, MI USA) operated at a base pressure of 7.0 × 10⁻¹¹ mbar. An Ar+ ion-sputtered silicon cantilever with an eigenfrequency of around 300 kHz and a quality factor of 22000 was used. The NC-AFM was operated in the frequency-modulation mode with an oscillation amplitude of 7.4 nm, and images shown herein were acquired in the quasi constant-height mode [18]. Frequency shift values printed in the respective images correspond to the setpoint of the feedback loop. LT experiments were performed at 77 K using a LT UHV STM/AFM (ScientaOmicron, Taunusstein, Germany) operated at a base pressure of 5 × 10⁻¹⁰ mbar. NC-AFM measurements were conducted with a quartz cantilever based on a tuning fork [27] and a chemically etched tungsten tip attached to the end of the active prong. The tip was further prepared in situ using common STM-based approaches on the bare Si surface after introducing the sensor into the vacuum system [28]. The NC-AFM microscope was operated in the frequency-modulation mode with an oscillation amplitude of 60 pm, and images were acquired in the true constant-height mode using an atom-tracking and feed-forward system for instantaneous drift compensation [29].
All frequency shift (Δf) images are presented with regions of strong attractive tip–sample interaction depicted as ‘bright’ and regions of weak attractive or repulsive interaction reproduced as ‘dark’. In NC-AFM, the frequency shift Δf is proportional to the weighted average of the tip–sample interaction force gradient [30]. Attractive forces mostly exhibiting a positive force gradient are considered as negative and yield a negative Δf according to a generally accepted convention. When acquiring data in the constant height mode, we invert Δf images so that a steeper force gradient appears as a brighter feature corresponding to an elevation in an image of the same feature taken in the constant frequency shift (topography) mode. Arrows in the upper right corner of Δf images represent the fast (horizontal) and slow (vertical) scan directions.
The surface directions for the bulk crystal exposing the (111) surface can be determined by cleaving the crystal along another surface from the {111} family [31]. For CaF2 thin films grown on Si(111) surfaces, it has been established that the film grows in type-B epitaxy [24,25,32]. This implies that the direction of the silicon crystal surface points in opposite direction of the direction of the CaF2 thin film. The direction of the pristine Si(111) (7 × 7) surface was determined by identifying the faulted and unfaulted halves of the (7 × 7) reconstructed unit cell from STM imaging [33]. With the surface orientation established, the sublattices can be identified through a distance-dependent analysis of NC-AFM images [10], and corresponding model drawings of the CaF2(111) surface geometry are superimposed on the image data.
To improve the signal-to-noise ratio of the Δf data in the RT experiments, unit cell averaging is performed as described in [10]. From the unit-cell averaged data, contrast profile lines Δf⟨uc⟩ are extracted along the diagonal of the unit cell in the direction, with the resulting data included as traces next to the respective NC-AFM images.
Results and Discussion
In Figure 2, we present RT data showing two examples of abrupt contrast changes where the polarity of the tip is maintained (polarity-preserving tip changes) but a different atomic contrast appears. The occurrences of tip changes are marked by the two chevron arrows framing the respective scan line. The nature of these changes as polarity preserving can be assessed from the contrast profiles shown in Figure 2b,c,e,f based on the conclusions in [10]. The image in Figure 2a maintains contrast mode C1, yet with an abrupt change in intensity (see Figure 2b,c), while the contrast change present in Figure 2d represents a transition from contrast mode C4 (see Figure 2f) to contrast mode C2 (see Figure 2e). The assignment of the contrast mode C4 follows a distance-dependent analysis of the data acquired prior to this image (data not shown). Positioning the CaF2(111) surface models in Figure 2a and Figure 2d relative to the NC-AFM data is based on the sublattice analysis of the contrast profiles shown in Figure 2b,c and Figure 2e,f, respectively. This positioning indicates that there is no lateral shift involved during the tip changes as the same lattice fits well before and after the tip changes. While this is true for the NC-AFM images shown here, images indicating a lateral shift upon a tip change are commonly observed. The assignment to a polarity-preserving tip change is based on the finding that for Figure 2a, the contrast mode C1 is related to a positively terminated tip, whereas for Figure 2d, the contrast modes C2 and C4 are both explained by a negatively terminated tip.
Figure 2:
Examples of polarity-preserving tip changes on CaF2(111) at room temperature. (a, d) Δf data acquired at (a) Δfset = −109 Hz and (d) −82.1 Hz with a top view CaF2(111) surface model overlaid. (b, c) and (e, f) Contrast profiles extracted along the direction of the unit-cell averaged data from image regions indicated by the square brackets. represents the distance between equivalent atoms along ⟨11−2⟩ directions, where a0 is the bulk lattice constant of CaF2. Atomic assignment follows the model introduced in [10], with the solid line in panels (b, c, e, f) representing a polynomial fit of degree seven as a guide to the eye.
Figure 2:
Examples of polarity-preserving tip changes on CaF2(111) at room temperature. (a, d) Δf data acquir...
Next, we discuss tip changes that modify the tip polarity with exemplary data for negative-to-positive and positive-to-negative transitions reproduced, respectively, in Figure 3a and Figure 3d. In particular, the image data in Figure 3a recorded at RT and the corresponding contrast profiles (Figure 3b,c) exemplify a contrast change from C2 (associated with a negatively terminated tip) to C3 (associated with a positively terminated tip). In contrast, the image data in Figure 3d acquired at LT and the corresponding contrast profiles (Figure 3e,f) show an abrupt change from contrast mode C1 to C4, implying a change from a positive to a negative tip termination. To maintain stable imaging, the tip was retracted by about 100 pm immediately after the tip change, explaining the abrupt change in image contrast. Based on the sublattice identification in the contrast profiles in Figure 3b,c and Figure 3e,f, we superimpose the CaF2(111) surface model to the data in Figure 3a and Figure 3d and furthermore find that the tip change clearly goes along with a change in polarity of the contrast forming tip cluster in both cases.
Figure 3:
Examples of polarity-changing tip changes on CaF2(111). (a) Δf data acquired at Δfset = −30.9 Hz (RT) and (d) Δf data acquired on a thin film sample at Δfset = −12.0 Hz (77 K). Top-view CaF2(111) surface models are overlaid. (b, c) and (e, f) show line profiles extracted along the direction of the unit-cell averaged data in the regions indicated by the square brackets. represents the distance between equivalent atoms along ⟨11−2⟩ directions, where a0 is the bulk lattice constant of CaF2. Atomic assignment follows the model introduced in [10], with the solid line in panels (b, c, e, f) representing a polynomial fit of degree seven as a guide to the eye.
Figure 3:
Examples of polarity-changing tip changes on CaF2(111). (a) Δf data acquired at Δfset = −30.9 Hz (R...
A tentative explanation for the positive-to-negative tip change is a pickup of a fluorine ion from the surface by the tip, resulting in a negative tip termination. As a consequence, the tip interacts strongly attractively with the surface Ca2+ ions, explaining the contrast enhancement induced by the tip change.
During the analysis of 213 images acquired at RT, we observed 32 tip changes, with repeated evidence for polarity changes in both directions. Among these, 72% resulted in negatively terminated tips, while 28% ended in positively terminated tips. Across all 213 analyzed images, 67% exhibited contrasts associated with negatively terminated tips and 33% with positively terminated tips. This consistent trend suggests that negative tip termination is the more stable configuration when imaging fluorite surfaces.
An intriguing example involving a sequence of tip changes to eventually arrive in contrast mode C4 is shown in Figure 4. Images in Figure 4a–c and Figure 4g–i represent image data acquired while step-wise decreasing the frequency shift setpoint. Such a reduction of the tip–surface distance eventually triggers tip changes. Contrast profiles for identifying the respective contrast modes are shown in Figure 4d–f and Figure 4j–l. It is found that the tip first yields contrast C1 (associated with a positively terminated tip) but experiences a polarity-changing tip change (Figure 4b) upon approach to the surface from contrast C1 to C2 (negatively terminated tip). Further approach reveals an unsteady C2 contrast (Figure 4c) as evidenced by the difference in contrast strength of the contrast profiles in Figure 4f, whereby the C2 contrast in the upper part (red contrast profile) is slightly weaker compared to that in the lower image half (blue contrast profile). A second polarity-preserving tip change is identified in the subsequent image in Figure 4g. Upon further decreasing the frequency shift setpoint, the C2 contrast stabilizes in Figure 4g to Figure 4h and eventually develops to contrast C4 (negatively terminated tip) in Figures 4i,l at further reduced tip–sample distance. While the evolution of contrast mode C2 to C4 is readily explained by the distance-dependence of imaging CaF2(111) with a negative tip [10], this series clearly shows the change from a previously positively terminated tip to a negatively terminated tip finally attaining a stable configuration.
Figure 4:
Tip changes leading to a successively stabilizing negative tip termination. (a–c) and (g–i) Δf data acquired while step-wise decreasing the tip–sample distance (Δfset = −60.2 Hz to −78.0 Hz). (d–f) and (j–l) Line profiles extracted along the direction of the unit-cell averaged data. represents the distance between equivalent atoms along ⟨11−2⟩ directions, where a0 is the bulk lattice constant of CaF2. Atomic assignment follows the model introduced in [10], with the solid line in panels (d–f) and (j–l) representing a polynomial fit of degree seven as a guide to the eye.
Figure 4:
Tip changes leading to a successively stabilizing negative tip termination. (a–c) and (g–i) Δf data...
Unlike in the RT data, where we observe both polarity-preserving and polarity-changing tip changes, at low temperature, so far no polarity-preserving tip changes were observed. This is a plausible result as tip stability is generally considered a merit of LT measurements. However, conclusions drawn from LT data are based on a much smaller number of measurements than those for RT data, and we anticipate that polarity-preserving tip changes at low temperature would be found as rare events in a sample of measurements with higher statistical significance.
Conclusion
In conclusion, we present NC-AFM data demonstrating tip changes on a bulk CaF2(111) surface at room temperature and on a CaF2/CaF/Si(111) thin film surface at 77 K. We demonstrate the effect of tip changes on the contrast formation and find, as a key result, routes for a discrimination between polarity-preserving tip changes and tip changes associated with a change in tip polarity. Experimental evidence of both cases is found, with a tendency for negative tip termination to be the more stable configuration. We tentatively interpret this finding as a result of picking up a surface fluorine ion by the tip.
Acknowledgements
P. R. gratefully acknowledges experimental support and discussions regarding the 77 K data with Philip Moriarty and Adam Sweetman.
Funding
The authors gratefully acknowledge funding from the Deutsche Forschungsgemeinschaft (DFG) via grant RA2832/1-1 and from FP7/2007-2013 under REA grant number 628439.
Author Contributions
Bob Kyeyune: conceptualization; data curation; formal analysis; investigation; visualization; writing – original draft; writing – review & editing. Philipp Rahe: conceptualization; data curation; funding acquisition; investigation; resources; writing – review & editing. Michael Reichling: conceptualization; funding acquisition; project administration; resources; supervision; validation; writing – review & editing.
Data Availability Statement
Data generated and analyzed during this study is available from the corresponding author upon reasonable request.
References
Albrecht, T. R.; Grütter, P.; Horne, D.; Rugar, D. J. Appl. Phys.1991,69, 668–673. doi:10.1063/1.347347
Return to citation in text:
[1]
Morita, S.; Abe, M.; Yokoyama, K.; Sugawara, Y. J. Cryst. Growth2000,210, 408–415. doi:10.1016/s0022-0248(99)00720-4
Return to citation in text:
[1]
Morita, S.; Sugimoto, Y.; Oyabu, N.; Nishi, R.; Custance, O.; Sugawara, Y.; Abe, M. J. Electron Microsc.2004,53, 163–168. doi:10.1093/jmicro/53.2.163
Return to citation in text:
[1]
Schütte, J.; Rahe, P.; Tröger, L.; Rode, S.; Bechstein, R.; Reichling, M.; Kühnle, A. Langmuir2010,26, 8295–8300. doi:10.1021/la904706p
Return to citation in text:
[1]
Rahe, P.; Schütte, J.; Kühnle, A. J. Phys.: Condens. Matter2012,24, 084006. doi:10.1088/0953-8984/24/8/084006
Return to citation in text:
[1]
Liebig, A.; Hapala, P.; Weymouth, A. J.; Giessibl, F. J. Sci. Rep.2020,10, 14104. doi:10.1038/s41598-020-71077-9
Return to citation in text:
[1]
[2]
Pavliček, N.; Gross, L. Nat. Rev. Chem.2017,1, 0005. doi:10.1038/s41570-016-0005
Return to citation in text:
[1]
Foster, A. S.; Barth, C.; Shluger, A. L.; Reichling, M. Phys. Rev. Lett.2001,86, 2373–2376. doi:10.1103/physrevlett.86.2373
Return to citation in text:
[1]
Hoffmann, R.; Weiner, D.; Schirmeisen, A.; Foster, A. S. Phys. Rev. B2009,80, 115426. doi:10.1103/physrevb.80.115426
Return to citation in text:
[1]
[2]
Liebig, A.; Peronio, A.; Meuer, D.; Weymouth, A. J.; Giessibl, F. J. New J. Phys.2020,22, 063040. doi:10.1088/1367-2630/ab8efd
Return to citation in text:
[1]
Jiménez-Sánchez, M. D.; Nicoara, N.; Gómez-Rodríguez, J. M. Appl. Surf. Sci.2021,542, 148669. doi:10.1016/j.apsusc.2020.148669
Return to citation in text:
[1]
Kawai, S.; Foster, A. S.; Björkman, T.; Nowakowska, S.; Björk, J.; Canova, F. F.; Gade, L. H.; Jung, T. A.; Meyer, E. Nat. Commun.2016,7, 11559. doi:10.1038/ncomms11559
Return to citation in text:
[1]
Mohn, F.; Schuler, B.; Gross, L.; Meyer, G. Appl. Phys. Lett.2013,102, 073109. doi:10.1063/1.4793200
Return to citation in text:
[1]
Bamidele, J.; Kinoshita, Y.; Turanský, R.; Lee, S. H.; Naitoh, Y.; Li, Y. J.; Sugawara, Y.; Štich, I.; Kantorovich, L. Phys. Rev. B2012,86, 155422. doi:10.1103/physrevb.86.155422
Return to citation in text:
[1]
Mönig, H.; Amirjalayer, S.; Timmer, A.; Hu, Z.; Liu, L.; Díaz Arado, O.; Cnudde, M.; Strassert, C. A.; Ji, W.; Rohlfing, M.; Fuchs, H. Nat. Nanotechnol.2018,13, 371–375. doi:10.1038/s41565-018-0104-4
Return to citation in text:
[1]
Wiesener, P.; Förster, S.; Merkel, M.; Schulze Lammers, B.; Fuchs, H.; Amirjalayer, S.; Mönig, H. ACS Nano2024,18, 21948–21956. doi:10.1021/acsnano.4c03155
Return to citation in text:
[1]
Barth, C.; Foster, A. S.; Reichling, M.; Shluger, A. L. J. Phys.: Condens. Matter2001,13, 2061–2079. doi:10.1088/0953-8984/13/10/303
Return to citation in text:
[1]
[2]
Hoffmann, R.; Kantorovich, L. N.; Baratoff, A.; Hug, H. J.; Güntherodt, H.-J. Phys. Rev. Lett.2004,92, 146103. doi:10.1103/physrevlett.92.146103
Return to citation in text:
[1]
Foster, A. S.; Shluger, A. L.; Nieminen, R. M. Nanotechnology2004,15, S60–S64. doi:10.1088/0957-4484/15/2/013
Return to citation in text:
[1]
Pou, P.; Ghasemi, S. A.; Jelinek, P.; Lenosky, T.; Goedecker, S.; Pérez, R. Nanotechnology2009,20, 264015. doi:10.1088/0957-4484/20/26/264015
Return to citation in text:
[1]
Yurtsever, A.; Fernández-Torre, D.; González, C.; Jelínek, P.; Pou, P.; Sugimoto, Y.; Abe, M.; Pérez, R.; Morita, S. Phys. Rev. B2012,85, 125416. doi:10.1103/physrevb.85.125416
Return to citation in text:
[1]
Tröger, L.; Schütte, J.; Ostendorf, F.; Kühnle, A.; Reichling, M. Rev. Sci. Instrum.2009,80, 063703. doi:10.1063/1.3152367
Return to citation in text:
[1]
Olmstead, M. A. Heteroepitaxy of Disparate Materials: From Chemisorption to Epitaxy in CaF2/Si(111). In Thin Films: Heteroepitaxial Systems; Liu, W. K.; Santos, M. B., Eds.; Series on Directions in Condensed Matter Physics; World Scientific: Singapore, 1999; pp 211–266. doi:10.1142/9789812816511_0005
Return to citation in text:
[1]
[2]
Wollschläger, J. Resonant tunneling devices based on epitaxial insulator-semiconductor structures: growth and characterisation of CaF2 films on Si(111). In Recent Research Developments in Applied Physics; Pandalai, S. G., Ed.; Transworld Research Network: Trivandrum, India, 2002; Vol. 5-II, pp 621–695.
Return to citation in text:
[1]
[2]
Rahe, P.; Smith, E. F.; Wollschläger, J.; Moriarty, P. J. Phys. Rev. B2018,97, 125418. doi:10.1103/physrevb.97.125418
Return to citation in text:
[1]
Giessibl, F. J. Appl. Phys. Lett.1998,73, 3956–3958. doi:10.1063/1.122948
Return to citation in text:
[1]
Sweetman, A.; Stirling, J.; Jarvis, S. P.; Rahe, P.; Moriarty, P. Phys. Rev. B2016,94, 115440. doi:10.1103/physrevb.94.115440
Return to citation in text:
[1]
Rahe, P.; Schütte, J.; Schniederberend, W.; Reichling, M.; Abe, M.; Sugimoto, Y.; Kühnle, A. Rev. Sci. Instrum.2011,82, 063704. doi:10.1063/1.3600453
Return to citation in text:
[1]
Söngen, H.; Bechstein, R.; Kühnle, A. J. Phys.: Condens. Matter2017,29, 274001. doi:10.1088/1361-648x/aa6f8b
Return to citation in text:
[1]
Kyeyune, B.; Olbrich, R.; Rahe, P.; Reichling, M. Rev. Sci. Instrum.2024,95, 023702. doi:10.1063/5.0182520
Return to citation in text:
[1]
Wollschläger, J. Appl. Phys. A: Mater. Sci. Process.2002,75, 155–166. doi:10.1007/s003390101064
Return to citation in text:
[1]
Sugimoto, Y.; Yi, I.; Morita, K.-i.; Abe, M.; Morita, S. Appl. Phys. Lett.2010,96, 263114. doi:10.1063/1.3457997
Return to citation in text:
[1]
Olmstead, M. A. Heteroepitaxy of Disparate Materials: From Chemisorption to Epitaxy in CaF2/Si(111). In Thin Films: Heteroepitaxial Systems; Liu, W. K.; Santos, M. B., Eds.; Series on Directions in Condensed Matter Physics; World Scientific: Singapore, 1999; pp 211–266. doi:10.1142/9789812816511_0005
25.
Wollschläger, J. Resonant tunneling devices based on epitaxial insulator-semiconductor structures: growth and characterisation of CaF2 films on Si(111). In Recent Research Developments in Applied Physics; Pandalai, S. G., Ed.; Transworld Research Network: Trivandrum, India, 2002; Vol. 5-II, pp 621–695.


![[2190-4286-16-72-1]](/bjnano/content/figures/2190-4286-16-72-1.png?scale=2.0&max-width=1024&background=FFFFFF)
![[Graphic 1]](/bjnano/content/inline/2190-4286-16-72-i1.svg?max-width=637&scale=1.18182) direction of the silicon crystal surface points in opposite direction of the
direction of the silicon crystal surface points in opposite direction of the ![[Graphic 2]](/bjnano/content/inline/2190-4286-16-72-i2.svg?max-width=637&scale=1.18182) direction of the CaF2 thin film. The
direction of the CaF2 thin film. The ![[Graphic 3]](/bjnano/content/inline/2190-4286-16-72-i3.svg?max-width=637&scale=1.18182) direction of the pristine Si(111) (7 × 7) surface was determined by identifying the faulted and unfaulted halves of the (7 × 7) reconstructed unit cell from STM imaging [33]. With the surface orientation established, the sublattices can be identified through a distance-dependent analysis of NC-AFM images [10], and corresponding model drawings of the CaF2(111) surface geometry are superimposed on the image data.
direction of the pristine Si(111) (7 × 7) surface was determined by identifying the faulted and unfaulted halves of the (7 × 7) reconstructed unit cell from STM imaging [33]. With the surface orientation established, the sublattices can be identified through a distance-dependent analysis of NC-AFM images [10], and corresponding model drawings of the CaF2(111) surface geometry are superimposed on the image data.![[Graphic 4]](/bjnano/content/inline/2190-4286-16-72-i4.svg?max-width=637&scale=1.18182) direction, with the resulting data included as traces next to the respective NC-AFM images.
direction, with the resulting data included as traces next to the respective NC-AFM images.![[2190-4286-16-72-2]](/bjnano/content/figures/2190-4286-16-72-2.png?scale=2.0&max-width=1024&background=FFFFFF)
![[Graphic 5]](/bjnano/content/inline/2190-4286-16-72-i5.svg?max-width=637&scale=1.18182) direction of the unit-cell averaged data from image regions indicated by the square brackets.
direction of the unit-cell averaged data from image regions indicated by the square brackets. ![[Graphic 6]](/bjnano/content/inline/2190-4286-16-72-i6.svg?max-width=637&scale=1.18182) represents the distance between equivalent atoms along ⟨11−2⟩ directions, where a0 is the bulk lattice constant of CaF2. Atomic assignment follows the model introduced in [10], with the solid line in panels (b, c, e, f) representing a polynomial fit of degree seven as a guide to the eye.
represents the distance between equivalent atoms along ⟨11−2⟩ directions, where a0 is the bulk lattice constant of CaF2. Atomic assignment follows the model introduced in [10], with the solid line in panels (b, c, e, f) representing a polynomial fit of degree seven as a guide to the eye.
![[2190-4286-16-72-3]](/bjnano/content/figures/2190-4286-16-72-3.png?scale=2.0&max-width=1024&background=FFFFFF)
![[Graphic 7]](/bjnano/content/inline/2190-4286-16-72-i7.svg?max-width=637&scale=1.18182) direction of the unit-cell averaged data in the regions indicated by the square brackets.
direction of the unit-cell averaged data in the regions indicated by the square brackets. ![[Graphic 8]](/bjnano/content/inline/2190-4286-16-72-i8.svg?max-width=637&scale=1.18182) represents the distance between equivalent atoms along ⟨11−2⟩ directions, where a0 is the bulk lattice constant of CaF2. Atomic assignment follows the model introduced in [10], with the solid line in panels (b, c, e, f) representing a polynomial fit of degree seven as a guide to the eye.
represents the distance between equivalent atoms along ⟨11−2⟩ directions, where a0 is the bulk lattice constant of CaF2. Atomic assignment follows the model introduced in [10], with the solid line in panels (b, c, e, f) representing a polynomial fit of degree seven as a guide to the eye.
![[2190-4286-16-72-4]](/bjnano/content/figures/2190-4286-16-72-4.png?scale=2.0&max-width=1024&background=FFFFFF)
![[Graphic 9]](/bjnano/content/inline/2190-4286-16-72-i9.svg?max-width=637&scale=1.18182) direction of the unit-cell averaged data.
direction of the unit-cell averaged data. ![[Graphic 10]](/bjnano/content/inline/2190-4286-16-72-i10.svg?max-width=637&scale=1.18182) represents the distance between equivalent atoms along ⟨11−2⟩ directions, where a0 is the bulk lattice constant of CaF2. Atomic assignment follows the model introduced in [10], with the solid line in panels (d–f) and (j–l) representing a polynomial fit of degree seven as a guide to the eye.
represents the distance between equivalent atoms along ⟨11−2⟩ directions, where a0 is the bulk lattice constant of CaF2. Atomic assignment follows the model introduced in [10], with the solid line in panels (d–f) and (j–l) representing a polynomial fit of degree seven as a guide to the eye.