


Abstract
A gas-phase photoelectron spectroscopy and X-ray absorption spectroscopy study of 1,2,3-benzotriazole and methyl derivatives was undertaken to investigate the influence of the tautomerism on the spectroscopic signature in greater detail. Soft X-ray photoelectron spectroscopy of the nitrogen core level, nitrogen K-edge near-edge X-ray absorption fine-structure measurements, and mapping of the resonant Auger spectroscopy were performed. High-energy ultraviolet photoemission spectroscopy was also undertaken to compare with the previous studies using low-energy Helium I and Helium II excitation. The gas-phase characterization is an essential step for interpreting adsorbed molecular phases and thin films on surfaces. The results also served as a test of STOBE density functional theory calculations, in particular the near edge.
Introduction
Nanoparticles and their properties, such as large surface area, tailored surfaces, and catalytic activity, play an important role in pharmaceutical, medicinal chemistry [1] and also synthetic chemistry [2]. Understanding the adsorption either from the liquid or gas phase, and its bonding in adsorbed molecular phases or thin films is fundamental to nanoparticle research.
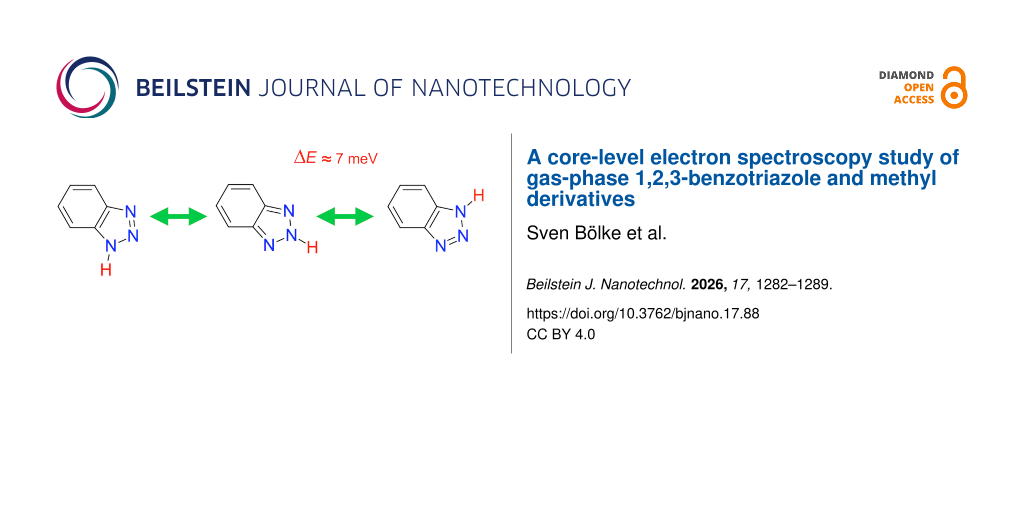
Benzotriazole (BTAH) is extensively used in diverse areas ranging from corrosion protection [3-5], synthetic chemistry [6-8], to pharmaceuticals, and medicine [9-11]. It displays a considerable variety in its adsorption behaviour on various surfaces, where hydrogen bonding can play an important role [12,13]. The material is a crystalline solid with a high degree of hydrogen bonding [14] and a high vapour pressure of 0.05 mbar at room temperature. In the gas phase, it has been demonstrated that the molecule exists in two tautomeric forms [15,16], 1H and 2H, shown in Figure 1.
![[2190-4286-17-88-1]](/bjnano/content/figures/2190-4286-17-88-1.svg?scale=2.0&max-width=1024&background=FFFFFF)
Figure 1: Molecular structures of 1,2,3-benzotriazole (BTAH), the two tautomers and the methyl derivatives 1-methylbenzotriazole (1-methylBTA), 2-methylbenzotriazole (2-methylBTA) and 5-methylbenzotriazole (5-methylBTA). For BTAH, delocalised bonding in the triazole ring is indicated by the coloured (and dashed) bonds, the hydrogen is omitted for clarity.
Figure 1: Molecular structures of 1,2,3-benzotriazole (BTAH), the two tautomers and the methyl derivatives 1-...
The ratio of tautomers at 100 °C is not clear from either theoretical or experimental studies [15,16]. The energies for the optimised structures of the tautomers and dimers from STOBE calculations differ by a few hundred milli electron volts and suggest that a dimeric structure is relatively stable. Consequently, given the large hydrogen bonding in the solid and its high vapour pressure at room temperature, BTAH may also exist as hydrogen-bonded dimers [13] in the gas phase. This might also explain the complexity seen in the valence photoelectron spectra using helium excitation [16-18].
The gas-phase electronic structure and bonding in the molecule is necessary to understand the adsorbed molecular phases and thin films on surfaces [19,20]. The electronic structure and bonding of BTAH is the theme of this study. Four molecules 1,2,3-benzotriazole, 5-methylbenzotriazole, 1-methylbenzotriazole, and 2-methylbenzotriazole, shown in Figure 1, were studied. The methyl derivatives were used to mimic the experimental nitrogen core-level spectra of the 1H and 2H tautomers without hydrogen bonding. Although studied, results for 5-methylbenzotriazole are not shown as they did not significantly differ from that of 1,2,3-benzotriazole. Core-level photoelectron spectroscopy (PES), ultraviolet phototoelectron spectrocopy (UPS), and near-edge X-ray absorption fine-structure (NEXAFS) spectroscopy measurements were performed at the PLEIADES beamline of the synchrotron SOLEIL (Paris, France). To substantiate the interpretation of the spectra, density functional theory (DFT) calculations were performed using the STOBE code [21]. The DFT calculations also served as a basis for using the core-level spectra of the methyl derivatives for modelling those of the hydrogen tautomers.
The energy range of the PLEIADES beamline enabled UPS measurements at higher photon energies, which are compared to previous studies [16-18] using He I,II (hν 21.23 eV, hν 40.80 eV) excitation. Near-edge X-ray absorption fine-structure spectroscopy is sensitive to changes in the unoccupied valence orbitals, and this was exploited in a previous study to illustrate hydrogen bonded polymerisation of benzotriazole on Au(111) and Cu/Au(111) surfaces [12,13]. The problems with possible assignment of the previous UPS was significant in choosing the atomic specificity of core-level spectroscopy with its relatively simpler interpretation.
Results and Discussion
Core-level PES, NEXAFS, and UPS
The study concentrated on the methyl derivatives of benzotriazole (see Figure 1) as tautomerism is absent in these molecules (except for 5-methylbenzotriazole). Core-level electron spectroscopy was chosen due to its specificity in identifying spectral features compared to the earlier UPS studies [16-18]. The UPS valence spectra of the earlier work of 1-methyl and 2-methylbenzotriazole, although similar to that of 1,2,3-benzotriazole, displayed differences that might be attributed to other bonding, and/or, to the calculation of the valence structure and multi-electron excitations. Such difficulties do not exist for the core-level spectroscopy, being relatively straightforward in assignment.
Figure 2 shows the area-normalised nitrogen core-level photoemission using soft X-ray energy photons of 500 eV for 1-methylbenzotriazole, 2-methylbenzotriazole, and 1,2,3- benzotriazole. The spectra are as expected. Two peaks (two different chemical environments, Figure 1) are visible for the symmetric 2-methylbenzotriazole and three peaks are visible for the asymmetric 1-methylbenzotriazole (three different chemical environments, Figure 1). The 1,2,3-benzotriazole spectrum can be seen to be resolved into a shifted (0.45 eV) two-component admixture of the above spectra: Four peaks are seen as two peaks with binding energy of ≈401 eV overlap. To confirm this and to investigate further STOBE [21] calculations of the two methyl derivatives and the two tautomers were performed. The red and blue open circles in Figure 2 represent the calculated nitrogen core-level binding energies of the two methyl derivatives, and the black circles for the 1H and 2H tautomers (vertically separated). The binding energies were shifted due to the vacuum level (work function of the analyser), and a relaxation shift was included which is not accounted for in the DFT calculations. The dashed lines are fits of an “asymmetric” Voigt profile (see Supporting Information File 1).
![[2190-4286-17-88-2]](/bjnano/content/figures/2190-4286-17-88-2.png?scale=2.0&max-width=1024&background=FFFFFF)
Figure 2: Nitrogen core-level photoelecltron spectra for 1-methylbenzotriazole, 2-methylbenzotriazole, and 1,2,3-benzotriazole. The open circles are the binding energies from STOBE calculations. 5-Methylbenzotriazole is omitted as there is little difference with BTAH.
Figure 2: Nitrogen core-level photoelecltron spectra for 1-methylbenzotriazole, 2-methylbenzotriazole, and 1,...
Asymmetry in the peaks is clearly visible and reflects the vibrations, rotational contributions, post-collision interactions [22,23], and other inelastic losses (here it is the vibrations [24]). The stoichiometry obtained from the fit of the spectra with the “asymmetric” Voigt yielded the expected atom ratios for the methyl derivatives. The black dashed line for BTAH is the admixture of fitting the methyl spectra (red and blue curves), and it has a small shift. The shift (0.45 eV) is ascribed to a differing relaxation present in the interchanging mixture of the two tautomers compared to that of the static molecules. The results of the fit give a mixture of 15.6% for the 2H-benzotriazole and 84.4% for the 1H-benzotriazole (1H-BTA/2H-BTA ratio 5.41 ± 9%), and does not agree with the vibrational spectroscopy study of Roth [15]: A question as to the relative stability of the two tautomers existed on account of calculations [15,16].
The NEXAFS of the 1-methyl and 2-methyl derivatives are shown in Figure 3 (spectra are normalised to the post-edge hν 420 eV) together with the fits of calculations to the spectra using STOBE [21] and the calculated oscillator strengths (bars in figure) with a varying peak width [25]. The variable width takes into account the decreasing monochromator resolution with photon energy, detector window, and larger lifetime broadening due to the increased decay channel density as the energy is increased.
![[2190-4286-17-88-3]](/bjnano/content/figures/2190-4286-17-88-3.png?scale=2.0&max-width=1024&background=FFFFFF)
Figure 3: Nitrogen K-edge NEXAFS for 1-methylbenzotriazole and 2-methylbenzotriazole. The blue curves are fits to the experimental spectra as described in the text. The transitions are depicted as bars in the plot.
Figure 3: Nitrogen K-edge NEXAFS for 1-methylbenzotriazole and 2-methylbenzotriazole. The blue curves are fit...
As with the photoelectron spectra, an “asymmetric” Voigt function (see Supporting Information File 1) was used. The fits are good showing the physics of the model, and the DFT calculation describes the gas-phase experimental spectra well.
The spectrum for 1,2,3-benzotriazole (Figure 4) shows that the principal features of both methyl spectra are also present. To compare the core-level photoelectron spectroscopic results for the tautomeric ratio with that of the 1,2,3-benzotriazole NEXAFS, the BTAH spectrum needs to be modelled. Although, the STOBE calculations and above fitting are good, to fit the experimental BTAH spectrum with a mixture of the methyl experimental spectra is a better approach: STOBE nitrogen-edge NEXAFS calculations for the 1H-benzotriazole and the 2H-benzotriazole also showed little difference with that of the methyl derivatives. The result of the fit (purple curve) is in good agreement with the experimental data. The fit yields 15% (red dashed curve) for the 2H tautomer and 85% (blue dashed curve) for the 1H tautomer (1H-BTA/2H-BTA ratio 5.66 ± 21%). This is in good agreement with the core-level photoemission fitting results above, and does not agree with the vibrational study of Roth [15].
![[2190-4286-17-88-4]](/bjnano/content/figures/2190-4286-17-88-4.png?scale=2.0&max-width=1024&background=FFFFFF)
Figure 4: Modelling of the BTAH NEXAFS spectrum using the experimental 1-methylbenzotriazole and 2-methylbenzotriazole spectra: STOBE calulations of the 1H and 2H tautomers showed negligible difference with the methyl derivative spectra. The curves for the methyl derivatives are smoothed to remove noise but preserve sharp features of the resonance, and represent actual contributions.
Figure 4: Modelling of the BTAH NEXAFS spectrum using the experimental 1-methylbenzotriazole and 2-methylbenz...
Photoelectron spectroscopy is a direct measure of the populations of the 1H and 2H tautomers compared to that deduced from the vibrational intensities with temperature by Roth [15]. The van’t Hoff isochore plot of Roth [15] is linear over the range studied (386–503 K) indicating its validity, but yields a ΔΗ![[Graphic 1]](/bjnano/content/inline/2190-4286-17-88-i1.png?max-width=637&scale=0.945456) too low to give the above population for a reasonable temperature of the cell. This might reflect that the equilibrium is changing in the lower region of the above range, and/or that unlike the Roth work the cell is not in thermal equilibrium and the temperature of the gas probed by the X-rays is uncertain. This may be the case as the cell is pumped by the main chamber. The probe by X-rays or infrared is considerably much faster than the inter conversion rate of the two tautomers. The above result for the tautomeric ratio and the STOBE modelling indicate that no other bonding [12] is seen in this low-pressure gas-phase study of BTAH.
too low to give the above population for a reasonable temperature of the cell. This might reflect that the equilibrium is changing in the lower region of the above range, and/or that unlike the Roth work the cell is not in thermal equilibrium and the temperature of the gas probed by the X-rays is uncertain. This may be the case as the cell is pumped by the main chamber. The probe by X-rays or infrared is considerably much faster than the inter conversion rate of the two tautomers. The above result for the tautomeric ratio and the STOBE modelling indicate that no other bonding [12] is seen in this low-pressure gas-phase study of BTAH.
As stated above, the UPS studies of Rademacher, Novak, and Leupin [16-18] were a motivation for the present experiment at PLEIADES as resolution and flux at both low and high energy far exceeded that of the previous studies. The UPS using 120 and 340 eV soft X-rays are shown in Figure 5 for the methyl derivatives and 1,2,3-benzotriazole (the 120 eV spectrum for 2-methylBTA is not shown due to a small water contamination). The higher-energy 340 eV spectra show a significant (expected) broadening in comparison to that of the lower-energy spectra. They are in reasonable agreement with previous studies [16-18] but differ principally in signal to noise and energy range. A simple admixture of the methyl spectra to obtain the BTAH spectrum and the tautomeric ratio was not successful presumably due to differing methyl contributions and other excitations in this region. STOBE calculations were not successful in fitting of the spectra. The calculation is beyond the scope of this study and requires calculating multi-electron excitations as described below.
![[2190-4286-17-88-5]](/bjnano/content/figures/2190-4286-17-88-5.png?scale=2.0&max-width=1024&background=FFFFFF)
Figure 5: Valence ultraviolet photoemission spectra for BTAH, 1-methylbenzotriazole and 2-methylbenzotriazole measured with photon energies of 120 and 340 eV. The 120 eV energy spectrum for 2-methylbenzotriazole is not shown due to a small water contamination.
Figure 5: Valence ultraviolet photoemission spectra for BTAH, 1-methylbenzotriazole and 2-methylbenzotriazole...
Resonant Auger spectroscopy and photon-energy/electron-energy maps
Resonant Auger spectroscopy (RAS) has been used to probe inter- and intramolecular charge transfer dynamics in femto- and atto-second time scales in thin films and at interfaces [26-29]. The spectra contain information about the delocalization of electronic states and the local nature of the excitation at a particular atom and allow the assignment of contributions in the valence region. This was also undertaken as differences in bonding, and excitations should result in additional structures being visible in the valence region which is not seen in the NEXAFS [12]. The data space is large as it involves both the electron kinetic energy and the photon energy. Typically, in such studies, a resonance in the NEXAFS is chosen and a photoelectron spectrum is taken covering both the valence region and the Auger peak. The beamline PLEIADES has sufficient photon flux and an analyser with a large collection angle, so that spectral maps [30] of photon energy versus electron binding energy (or kinetic energy) can be generated, making it easier to distinguish details, such as the spectator and participator trends, and help to identify and distinguish multi-electron excitations in the valence region.
Such a map is shown for 1-methylbenzotriazole in Figure 6 and displays the photoemission and Auger transition as a function of photon energy and electron binding energy. Below the nitrogen K edge in the pre-edge region, the spectra simply reflect the valence structure albeit with considerable broadening compared to the valence spectra measured with lower photon energies.
![[2190-4286-17-88-6]](/bjnano/content/figures/2190-4286-17-88-6.png?scale=2.3&max-width=1024&background=FFFFFF)
Figure 6: Shows a large-range Auger resonance map of the NEXAFS and Auger region. Sharp peaks (shoulders), also constant in kinetic energy, are visible on the broad Auger peak. The inset shows a detailed map scan of the NEXAFS region clearly showing peaks on resonance in the valence region, demonstrating both Auger- and photoelectron-like behaviour. The spectra shown on the right are the NEXAFS after integrating the two regions.
Figure 6: Shows a large-range Auger resonance map of the NEXAFS and Auger region. Sharp peaks (shoulders), al...
As the photon energy is increased, a resonant structure appears in the valence region with increased intensity for certain transitions. A detailed region is shown in the inset. Looking closely, some of the resonances appear to disperse, decrease with photon energy (constant kinetic energy) are Auger like and/or, behave as photoelectrons (constant binding energy). The resonances are attributed to the participator and spectator excitations: there is interference involved as before and after resonance the intensity is comparable but on resonance it is an order of magnitude larger.
In addition, a broad peak can be identified which is due to spectator autoionisation (see below). Above the edge, the Auger peak is clearly visible but is shifting in kinetic energy due to the post-collision interaction [22,23] before remaining constant in energy. On the right handside of the maps in Figure 6 are the NEXAFS spectra obtained by integrating the signal with binding energy for the wide scan and the detailed region of the inset. The spectra differ due to the different contributions of the Auger transition (kinetic energy of 374.2 eV).
On closer inspection, relatively sharp shoulders (kinetic energies of 377.55, 379.45, and 381.35 eV) can be discerned on the Auger peak, which are also constant in kinetic energy. These are attributed to Auger lines involving the very outer valence electrons and are long lived similar to those seen for molecular nitrogen [31-34]. This is shown in detail in Figure 7, which shows the Auger excitation for photon energies of 440 and 420 eV together with a valence spectrum (hν 395 eV). The Auger spectrum taken at 440 eV has been shifted and scaled to lie on top of the 420 eV spectrum. The blue dashed line is the spectrum shifted and scaled to a hypothetical position for photons of 395 eV, and lies on top of the valence region. It is clearly seen that the sharp shoulders are in the valence region, indicating that they are a two-valence (multi-electron) electron excitation.
![[2190-4286-17-88-7]](/bjnano/content/figures/2190-4286-17-88-7.png?scale=2.0&max-width=1024&background=FFFFFF)
Figure 7: Valence region just below the NEXAFS region and Auger spectra taken above the edge showing sharp shoulders on the Auger peak. See text for a more detailed description.
Figure 7: Valence region just below the NEXAFS region and Auger spectra taken above the edge showing sharp sh...
The valence occupied orbital structure is insufficient to explain the valence spectra and requires other contributions, excitations. The simplest is to include excitations to the unoccupied states of the molecule. A simple model was used to calculate the Auger excitation and additional valence excitation, satellites – see Supporting Information File 1 and Figure S1. The model shows a broad spectrum of possible one electron excitations into the valence region and above, and the two electron excitations reproduce the position and envelope of the Auger transition. However, the simple model is unable to calculate the detailed structure as this requires calculation of the transition probabilities and interference of the various states, which is outside the scope of this experimental study. The availability and energy of the satellite excitations indicates that these features are also present at low photon energy.
Figure 8 shows scans for the two resonances (399.7 and 404.0 eV) of 2-methylbenzotriazole, valence region (hν 395 eV) and the Auger region (hν 440 eV). The two resonant spectra show that a large number of excitations are present in the valence region as is indicated by the simple model (Support Information File 1). Also seen are broad peaks which resemble the Auger peak and result from autoionisation of the spectator excitations. The resulting Auger transitions are shifted in energy due to screening by the spectator electron. The calculation of these spectra is beyond the scope of this work [24].
![[2190-4286-17-88-8]](/bjnano/content/figures/2190-4286-17-88-8.png?scale=2.0&max-width=1024&background=FFFFFF)
Figure 8: Resonance spectra for 2-methylbenzotriazole, valence region, and Auger region. See text for a more detailed description.
Figure 8: Resonance spectra for 2-methylbenzotriazole, valence region, and Auger region. See text for a more ...
Conclusion
A core-level spectroscopic study of BTAH and its methyl derivatives was undertaken to characterise the gas phase, investigate the exhibited tautomerism, and the electronic structure of the molecules. This is a necessary step to understand the adsorbed molecular phases and thin films on surfaces. The STOBE DFT calculations explained well the experimental core-level photoemission and NEXAFS of the gas phase. The maps and Auger resonance spectra show a rich, diverse, and complex behaviour illustrating the spectator, participator (satellite structures), and post-collision interactions. The calculations, however, could not explain the UPS or Auger resonance structure. More detailed calculations are required including interference of the various states and multi-electron transitions, the subject of a separate work. However, it is evident that one-electron and two-electron excitations are responsible for additional structure in the valence region and are also present at low-photon energy excitation.
Experimental
The experiments were carried out at the PLEIADES [24,35] beamline at the French synchrotron SOLEIL (Paris). The monochromator is a variable line-spaced (VLS) and variable groove-depth (VGD) plane-grating monochromator (PGM) without an entrance slit using an Apple II permanent magnet undulator. The measurement chamber is equipped with a VG-SCIENTA R4000 WAL electrostatic spherical energy analyser. NEXAFS was measured using the nitrogen Auger electron transition. This was used instead of the partial electron yield, or total electron yield detection as the signal from the chamber residual gas background along the synchrotron light path dominated the signal (strong π–π* resonance – Prince, Feiffel [36,37]). As a consequence, the signal from the light interaction region of the in situ cell and the analyser focus was used avoiding nonfocussed contributions.
The vapour pressure of the liquid 2-methylbenzotriazole is sufficiently high at room temperature to allow direct dosing for the experiment. Further purification of 2-methylbenzotriazole was performed by freeze/thaw cycles. For the other molecules, an in situ evaporation cell was used to achieve a high enough pressure. The conditions and temperatures for the steady-state operation of the cell was found by careful gradual heating while monitoring the pressure, temperature, and signal. This avoided sudden gas bursts during the analyser operation. Differential pumping was needed to obtain a high enough gas pressure at the cell focus and was achieved through increased length of the tubes facilitating the entrance and exit of the X-rays to the cell. This ensured that the background analyser pressure stayed below 1 × 10⁻⁶ mbar. Nitrogen NEXAFS was obtained using the nitrogen Auger peak measured with a high analyser pass energy and a kinetic energy to maximise the signal-to-noise ratio and avoid including the direct photoelectron signals.
All of the methyl-substituted benzyotriazoles and BTAH of sufficient purity could be bought commercially apart from the 2-methylbenzotriazole. This molecule was successfully synthesised by AK Bräse at the Institut für Organische Chemie at the Karlsruher Institut für Technologie (KIT) for the beamtimes.
The binding energies for the core photoemission and NEXAFS calculations used for the fitting procedure of the data were calculated by using the DFT program STOBE [21] as described in the results and discussion section and in Supporting Information File 1. The structures were energy optimised and the bond lengths agreed with that found in other studies [16].
Supporting Information
| Supporting Information File 1: Additional information. | ||
| Format: PDF | Size: 641.6 KB | Download |
Acknowledgements
SOLEIL is gratefully acknowledged for providing beamtime (PRC2019152, PRC20201008), financial assistance, and guesthouse accommodation. The KIT and the University of Tübingen are thanked for providing the financial resources for the experiments and stay. The AK Bräse at the Institut für Organische Chemie is gratefully thanked for the synthesis of 2-methylBTA. K. Greulich and S. Kitsch (University of Tübingen) are also thanked for help during the initial and final beamtime. E. Robert and A. Milosavljevic (SOLEIL) are also thanked for technical assistance and engagement at PLEIADES.
Data Availability Statement
Data generated and analyzed during this study is available from the corresponding author upon reasonable request.
References
-
Lin, W. Chem. Rev. 2015, 115, 10407–10409. doi:10.1021/acs.chemrev.5b00534
Return to citation in text: [1] -
Chauhan, D. L.; Wanjari, S. S.; Katiya, M. M. Chem. Phys. Impact 2025, 11, 100932. doi:10.1016/j.chphi.2025.100932
Return to citation in text: [1] -
Brusic, V.; Frisch, M. A.; Eldridge, B. N.; Novak, F. P.; Kaufman, F. B.; Rush, B. M.; Frankel, G. S. J. Electrochem. Soc. 1991, 138, 2253–2259. doi:10.1149/1.2085957
Return to citation in text: [1] -
Finšgar, M.; Milošev, I. Corros. Sci. 2010, 52, 2737–2749. doi:10.1016/j.corsci.2010.05.002
Return to citation in text: [1] -
Figueiredo, J.; Perina, F.; Carneiro, D.; Iqbal, M. A.; Oliveira, T.; Rocha, C.; Maia, F.; Tedim, J.; Martins, R. Environ. Sci.: Nano 2025, 12, 3565–3580. doi:10.1039/d4en00919c
Return to citation in text: [1] -
Katritzky, A. R.; Rachwal, S.; Hitchings, G. J. Tetrahedron 1991, 47, 2683–2732. doi:10.1016/s0040-4020(01)87080-0
Return to citation in text: [1] -
Jabeen, F.; Panda, S. S.; Kondratyuk, T. P.; Park, E.-J.; Pezzuto, J. M.; Ihsan-ul-haq; Hall, C. D.; Katritzky, A. R. Bioorg. Med. Chem. Lett. 2015, 25, 2980–2984. doi:10.1016/j.bmcl.2015.05.020
Return to citation in text: [1] -
Gérardy, R.; Monbaliu, J.-C. M. Preparation, Reactivity, and Synthetic Utility of Simple Benzotriazole Derivatives. In The Chemistry of Benzotriazole Derivatives; Monbaliu, J.-C. M., Ed.; Topics in Heterocyclic Chemistry, Vol. 43; Springer: Cham, Switzerland, 2015; pp 1–66. doi:10.1007/7081_2015_179
Return to citation in text: [1] -
Briguglio, I.; Piras, S.; Corona, P.; Gavini, E.; Nieddu, M.; Boatto, G.; Carta, A. Eur. J. Med. Chem. 2015, 97, 612–648. doi:10.1016/j.ejmech.2014.09.089
Return to citation in text: [1] -
Sharma, M.; Thakur, D.; Nidhi; Verma, A. K. Chem. Commun. 2024, 60, 12840–12851. doi:10.1039/d4cc04450a
Return to citation in text: [1] -
Alagarasan, J. K.; Ullapu, P. R.; Gedi, S.; Minnam Reddy, V. R.; Putta, R. R. J. Heterocycl. Chem. 2025, 62, 1559–1594. doi:10.1002/jhet.70066
Return to citation in text: [1] -
Grillo, F.; Batchelor, D.; Larrea, C. R.; Francis, S. M.; Lacovig, P.; Richardson, N. V. Nanoscale 2019, 11, 13017–13031. doi:10.1039/c9nr04152d
Return to citation in text: [1] [2] [3] [4] -
Grillo, F.; Garrido Torres, J. A.; Treanor, M.-J.; Larrea, C. R.; Götze, J. P.; Lacovig, P.; Früchtl, H. A.; Schaub, R.; Richardson, N. V. Nanoscale 2016, 8, 9167–9177. doi:10.1039/c6nr00821f
Return to citation in text: [1] [2] [3] -
Krawczyk, S.; Gdaniec, M. Acta Crystallogr., Sect. E: Struct. Rep. Online 2005, 61, o2967–o2969. doi:10.1107/s1600536805025523
Return to citation in text: [1] -
Roth, W.; Spangenberg, D.; Janzen, C.; Westphal, A.; Schmitt, M. Chem. Phys. 1999, 248, 17–25. doi:10.1016/s0301-0104(99)00262-1
Return to citation in text: [1] [2] [3] [4] [5] [6] [7] -
Novak, I.; Abu-Izneid, T.; Kovač, B.; Klasinc, L. J. Phys. Chem. A 2009, 113, 9751–9756. doi:10.1021/jp905640b
Return to citation in text: [1] [2] [3] [4] [5] [6] [7] [8] [9] -
Rademacher, P.; Kowski, K.; Katritzky, A. R.; Denisenko, S. N. J. Mol. Struct. 1999, 513, 47–62. doi:10.1016/s0022-2860(99)00116-7
Return to citation in text: [1] [2] [3] [4] [5] -
Leupin, W.; Heilbronner, E.; Wirz, J. J. Mol. Struct. 1980, 68, 329–331. doi:10.1016/0022-2860(80)80284-5
Return to citation in text: [1] [2] [3] [4] [5] -
Dori, N.; Menon, M.; Kilian, L.; Sokolowski, M.; Kronik, L.; Umbach, E. Phys. Rev. B 2006, 73, 195208. doi:10.1103/physrevb.73.195208
Return to citation in text: [1] -
Scholz, M.; Holch, F.; Sauer, C.; Wiessner, M.; Schöll, A.; Reinert, F. Phys. Rev. Lett. 2013, 111, 048102. doi:10.1103/physrevlett.111.048102
Return to citation in text: [1] -
StoBe-deMon, version 3.3; 2014, https://www.fhi.mpg.de/1022673/StoBe.
Return to citation in text: [1] [2] [3] [4] -
Dupuy, R.; Penent, F.; Lutet-Toti, B.; Duval, V.; Palaudoux, J.; Céolin, D. Phys. Rev. A 2025, 112, 022824. doi:10.1103/w8nr-cmw1
Return to citation in text: [1] [2] -
Velasquez, N.; Travnikova, O.; Guillemin, R.; Ismail, I.; Journel, L.; Martins, J. B.; Koulentianos, D.; Céolin, D.; Fillaud, L.; Rocco, M. L. M.; Püttner, R.; Piancastelli, M. N.; Simon, M.; Sheinerman, S.; Gerchikov, L.; Marchenko, T. Phys. Rev. Res. 2023, 5, 013048. doi:10.1103/physrevresearch.5.013048
Return to citation in text: [1] [2] -
Holland, D. M. P.; McGhee, H. G.; Lamanec, M.; Nachtigallová, D.; Milosavljević, A.; Bozek, J. D.; Muchová, E.; Ingle, R. A. Chem. Sci. 2026, 17, 7773–7786. doi:10.1039/d5sc09051b
Return to citation in text: [1] [2] [3] -
Batchelor, D. R.; Aygül, U.; Dettinger, U.; Ivanovic, M.; Tournebize, A.; Mangold, S.; Forster, M.; Scherf, U.; Peisert, H.; Chassé, T. Eur. Polym. J. 2016, 81, 686–693. doi:10.1016/j.eurpolymj.2016.04.005
Return to citation in text: [1] -
Brühwiler, P. A.; Karis, O.; Mårtensson, N. Rev. Mod. Phys. 2002, 74, 703–740. doi:10.1103/revmodphys.74.703
Return to citation in text: [1] -
Öhrwall, G.; Fink, R. F.; Tchaplyguine, M.; Ojamäe, L.; Lundwall, M.; Marinho, R. R. T.; Naves de Brito, A.; Sorensen, S. L.; Gisselbrecht, M.; Feifel, R.; Rander, T.; Lindblad, A.; Schulz, J.; Sæthre, L. J.; Mårtensson, N.; Svensson, S.; Björneholm, O. J. Chem. Phys. 2005, 123, 054310. doi:10.1063/1.1989319
Return to citation in text: [1] -
Johansson, F. O. L.; Ivanović, M.; Svanström, S.; Cappel, U. B.; Peisert, H.; Chassé, T.; Lindblad, A. J. Phys. Chem. C 2018, 122, 12605–12614. doi:10.1021/acs.jpcc.8b02453
Return to citation in text: [1] -
Petraki, F.; Peisert, H.; Biswas, I.; Aygül, U.; Latteyer, F.; Vollmer, A.; Chassé, T. J. Phys. Chem. Lett. 2010, 1, 3380–3384. doi:10.1021/jz101395s
Return to citation in text: [1] -
Batchelor, D. R.; Schmidt, T.; Follath, R.; Jung, C.; Fink, R.; Knupfer, M.; Schöll, A.; Noll, T.; Siewert, F.; Büchner, B.; Umbach, E. Nucl. Instrum. Methods Phys. Res., Sect. A 2007, 575, 470–475. doi:10.1016/j.nima.2007.02.108
Return to citation in text: [1] -
Gelius, U. J. Electron Spectrosc. Relat. Phenom. 1974, 5, 985–1057. doi:10.1016/0368-2048(74)85064-4
Return to citation in text: [1] -
Moddeman, W. E.; Carlson, T. A.; Krause, M. O.; Pullen, B. P.; Bull, W. E.; Schweitzer, G. K. J. Chem. Phys. 1971, 55, 2317–2336. doi:10.1063/1.1676411
Return to citation in text: [1] -
Sambe, H.; Ramaker, D. E. Chem. Phys. Lett. 1986, 128, 113–117. doi:10.1016/0009-2614(86)80307-4
Return to citation in text: [1] -
Sorensen, S. L.; Miron, C.; Feifel, R.; Piancastelli, M.-N.; Björneholm, O.; Svensson, S. Chem. Phys. Lett. 2008, 456, 1–6. doi:10.1016/j.cplett.2008.03.015
Return to citation in text: [1] -
SOLEIL Synchrotron, Beamline, PLÉIADES. https://www.synchrotron-soleil.fr/fr/lignes-de-lumiere/pleiades.
Return to citation in text: [1] -
Prince, K. C.; Vondráček, M.; Karvonen, J.; Coreno, M.; Camilloni, R.; Avaldi, L.; de Simone, M. J. Electron Spectrosc. Relat. Phenom. 1999, 101–103, 141–147. doi:10.1016/s0368-2048(98)00436-8
Return to citation in text: [1] -
Feifel, R.; Andersson, M.; Öhrwall, G.; Sorensen, S. L.; Piancastelli, M. N.; Tchaplyguine, M.; Björneholm, O.; Karlsson, L.; Svensson, S. Chem. Phys. Lett. 2004, 383, 222–229. doi:10.1016/j.cplett.2003.11.026
Return to citation in text: [1]
| 16. | Novak, I.; Abu-Izneid, T.; Kovač, B.; Klasinc, L. J. Phys. Chem. A 2009, 113, 9751–9756. doi:10.1021/jp905640b |
| 17. | Rademacher, P.; Kowski, K.; Katritzky, A. R.; Denisenko, S. N. J. Mol. Struct. 1999, 513, 47–62. doi:10.1016/s0022-2860(99)00116-7 |
| 18. | Leupin, W.; Heilbronner, E.; Wirz, J. J. Mol. Struct. 1980, 68, 329–331. doi:10.1016/0022-2860(80)80284-5 |
| 16. | Novak, I.; Abu-Izneid, T.; Kovač, B.; Klasinc, L. J. Phys. Chem. A 2009, 113, 9751–9756. doi:10.1021/jp905640b |
| 17. | Rademacher, P.; Kowski, K.; Katritzky, A. R.; Denisenko, S. N. J. Mol. Struct. 1999, 513, 47–62. doi:10.1016/s0022-2860(99)00116-7 |
| 18. | Leupin, W.; Heilbronner, E.; Wirz, J. J. Mol. Struct. 1980, 68, 329–331. doi:10.1016/0022-2860(80)80284-5 |
| 26. | Brühwiler, P. A.; Karis, O.; Mårtensson, N. Rev. Mod. Phys. 2002, 74, 703–740. doi:10.1103/revmodphys.74.703 |
| 27. | Öhrwall, G.; Fink, R. F.; Tchaplyguine, M.; Ojamäe, L.; Lundwall, M.; Marinho, R. R. T.; Naves de Brito, A.; Sorensen, S. L.; Gisselbrecht, M.; Feifel, R.; Rander, T.; Lindblad, A.; Schulz, J.; Sæthre, L. J.; Mårtensson, N.; Svensson, S.; Björneholm, O. J. Chem. Phys. 2005, 123, 054310. doi:10.1063/1.1989319 |
| 28. | Johansson, F. O. L.; Ivanović, M.; Svanström, S.; Cappel, U. B.; Peisert, H.; Chassé, T.; Lindblad, A. J. Phys. Chem. C 2018, 122, 12605–12614. doi:10.1021/acs.jpcc.8b02453 |
| 29. | Petraki, F.; Peisert, H.; Biswas, I.; Aygül, U.; Latteyer, F.; Vollmer, A.; Chassé, T. J. Phys. Chem. Lett. 2010, 1, 3380–3384. doi:10.1021/jz101395s |
| 9. | Briguglio, I.; Piras, S.; Corona, P.; Gavini, E.; Nieddu, M.; Boatto, G.; Carta, A. Eur. J. Med. Chem. 2015, 97, 612–648. doi:10.1016/j.ejmech.2014.09.089 |
| 10. | Sharma, M.; Thakur, D.; Nidhi; Verma, A. K. Chem. Commun. 2024, 60, 12840–12851. doi:10.1039/d4cc04450a |
| 11. | Alagarasan, J. K.; Ullapu, P. R.; Gedi, S.; Minnam Reddy, V. R.; Putta, R. R. J. Heterocycl. Chem. 2025, 62, 1559–1594. doi:10.1002/jhet.70066 |
| 12. | Grillo, F.; Batchelor, D.; Larrea, C. R.; Francis, S. M.; Lacovig, P.; Richardson, N. V. Nanoscale 2019, 11, 13017–13031. doi:10.1039/c9nr04152d |
| 13. | Grillo, F.; Garrido Torres, J. A.; Treanor, M.-J.; Larrea, C. R.; Götze, J. P.; Lacovig, P.; Früchtl, H. A.; Schaub, R.; Richardson, N. V. Nanoscale 2016, 8, 9167–9177. doi:10.1039/c6nr00821f |
| 36. | Prince, K. C.; Vondráček, M.; Karvonen, J.; Coreno, M.; Camilloni, R.; Avaldi, L.; de Simone, M. J. Electron Spectrosc. Relat. Phenom. 1999, 101–103, 141–147. doi:10.1016/s0368-2048(98)00436-8 |
| 37. | Feifel, R.; Andersson, M.; Öhrwall, G.; Sorensen, S. L.; Piancastelli, M. N.; Tchaplyguine, M.; Björneholm, O.; Karlsson, L.; Svensson, S. Chem. Phys. Lett. 2004, 383, 222–229. doi:10.1016/j.cplett.2003.11.026 |
| 6. | Katritzky, A. R.; Rachwal, S.; Hitchings, G. J. Tetrahedron 1991, 47, 2683–2732. doi:10.1016/s0040-4020(01)87080-0 |
| 7. | Jabeen, F.; Panda, S. S.; Kondratyuk, T. P.; Park, E.-J.; Pezzuto, J. M.; Ihsan-ul-haq; Hall, C. D.; Katritzky, A. R. Bioorg. Med. Chem. Lett. 2015, 25, 2980–2984. doi:10.1016/j.bmcl.2015.05.020 |
| 8. | Gérardy, R.; Monbaliu, J.-C. M. Preparation, Reactivity, and Synthetic Utility of Simple Benzotriazole Derivatives. In The Chemistry of Benzotriazole Derivatives; Monbaliu, J.-C. M., Ed.; Topics in Heterocyclic Chemistry, Vol. 43; Springer: Cham, Switzerland, 2015; pp 1–66. doi:10.1007/7081_2015_179 |
| 16. | Novak, I.; Abu-Izneid, T.; Kovač, B.; Klasinc, L. J. Phys. Chem. A 2009, 113, 9751–9756. doi:10.1021/jp905640b |
| 17. | Rademacher, P.; Kowski, K.; Katritzky, A. R.; Denisenko, S. N. J. Mol. Struct. 1999, 513, 47–62. doi:10.1016/s0022-2860(99)00116-7 |
| 18. | Leupin, W.; Heilbronner, E.; Wirz, J. J. Mol. Struct. 1980, 68, 329–331. doi:10.1016/0022-2860(80)80284-5 |
| 3. | Brusic, V.; Frisch, M. A.; Eldridge, B. N.; Novak, F. P.; Kaufman, F. B.; Rush, B. M.; Frankel, G. S. J. Electrochem. Soc. 1991, 138, 2253–2259. doi:10.1149/1.2085957 |
| 4. | Finšgar, M.; Milošev, I. Corros. Sci. 2010, 52, 2737–2749. doi:10.1016/j.corsci.2010.05.002 |
| 5. | Figueiredo, J.; Perina, F.; Carneiro, D.; Iqbal, M. A.; Oliveira, T.; Rocha, C.; Maia, F.; Tedim, J.; Martins, R. Environ. Sci.: Nano 2025, 12, 3565–3580. doi:10.1039/d4en00919c |
| 24. | Holland, D. M. P.; McGhee, H. G.; Lamanec, M.; Nachtigallová, D.; Milosavljević, A.; Bozek, J. D.; Muchová, E.; Ingle, R. A. Chem. Sci. 2026, 17, 7773–7786. doi:10.1039/d5sc09051b |
| 2. | Chauhan, D. L.; Wanjari, S. S.; Katiya, M. M. Chem. Phys. Impact 2025, 11, 100932. doi:10.1016/j.chphi.2025.100932 |
| 16. | Novak, I.; Abu-Izneid, T.; Kovač, B.; Klasinc, L. J. Phys. Chem. A 2009, 113, 9751–9756. doi:10.1021/jp905640b |
| 17. | Rademacher, P.; Kowski, K.; Katritzky, A. R.; Denisenko, S. N. J. Mol. Struct. 1999, 513, 47–62. doi:10.1016/s0022-2860(99)00116-7 |
| 18. | Leupin, W.; Heilbronner, E.; Wirz, J. J. Mol. Struct. 1980, 68, 329–331. doi:10.1016/0022-2860(80)80284-5 |
| 24. | Holland, D. M. P.; McGhee, H. G.; Lamanec, M.; Nachtigallová, D.; Milosavljević, A.; Bozek, J. D.; Muchová, E.; Ingle, R. A. Chem. Sci. 2026, 17, 7773–7786. doi:10.1039/d5sc09051b |
| 35. | SOLEIL Synchrotron, Beamline, PLÉIADES. https://www.synchrotron-soleil.fr/fr/lignes-de-lumiere/pleiades. |
| 15. | Roth, W.; Spangenberg, D.; Janzen, C.; Westphal, A.; Schmitt, M. Chem. Phys. 1999, 248, 17–25. doi:10.1016/s0301-0104(99)00262-1 |
| 16. | Novak, I.; Abu-Izneid, T.; Kovač, B.; Klasinc, L. J. Phys. Chem. A 2009, 113, 9751–9756. doi:10.1021/jp905640b |
| 16. | Novak, I.; Abu-Izneid, T.; Kovač, B.; Klasinc, L. J. Phys. Chem. A 2009, 113, 9751–9756. doi:10.1021/jp905640b |
| 17. | Rademacher, P.; Kowski, K.; Katritzky, A. R.; Denisenko, S. N. J. Mol. Struct. 1999, 513, 47–62. doi:10.1016/s0022-2860(99)00116-7 |
| 18. | Leupin, W.; Heilbronner, E.; Wirz, J. J. Mol. Struct. 1980, 68, 329–331. doi:10.1016/0022-2860(80)80284-5 |
| 22. | Dupuy, R.; Penent, F.; Lutet-Toti, B.; Duval, V.; Palaudoux, J.; Céolin, D. Phys. Rev. A 2025, 112, 022824. doi:10.1103/w8nr-cmw1 |
| 23. | Velasquez, N.; Travnikova, O.; Guillemin, R.; Ismail, I.; Journel, L.; Martins, J. B.; Koulentianos, D.; Céolin, D.; Fillaud, L.; Rocco, M. L. M.; Püttner, R.; Piancastelli, M. N.; Simon, M.; Sheinerman, S.; Gerchikov, L.; Marchenko, T. Phys. Rev. Res. 2023, 5, 013048. doi:10.1103/physrevresearch.5.013048 |
| 15. | Roth, W.; Spangenberg, D.; Janzen, C.; Westphal, A.; Schmitt, M. Chem. Phys. 1999, 248, 17–25. doi:10.1016/s0301-0104(99)00262-1 |
| 16. | Novak, I.; Abu-Izneid, T.; Kovač, B.; Klasinc, L. J. Phys. Chem. A 2009, 113, 9751–9756. doi:10.1021/jp905640b |
| 19. | Dori, N.; Menon, M.; Kilian, L.; Sokolowski, M.; Kronik, L.; Umbach, E. Phys. Rev. B 2006, 73, 195208. doi:10.1103/physrevb.73.195208 |
| 20. | Scholz, M.; Holch, F.; Sauer, C.; Wiessner, M.; Schöll, A.; Reinert, F. Phys. Rev. Lett. 2013, 111, 048102. doi:10.1103/physrevlett.111.048102 |
| 31. | Gelius, U. J. Electron Spectrosc. Relat. Phenom. 1974, 5, 985–1057. doi:10.1016/0368-2048(74)85064-4 |
| 32. | Moddeman, W. E.; Carlson, T. A.; Krause, M. O.; Pullen, B. P.; Bull, W. E.; Schweitzer, G. K. J. Chem. Phys. 1971, 55, 2317–2336. doi:10.1063/1.1676411 |
| 33. | Sambe, H.; Ramaker, D. E. Chem. Phys. Lett. 1986, 128, 113–117. doi:10.1016/0009-2614(86)80307-4 |
| 34. | Sorensen, S. L.; Miron, C.; Feifel, R.; Piancastelli, M.-N.; Björneholm, O.; Svensson, S. Chem. Phys. Lett. 2008, 456, 1–6. doi:10.1016/j.cplett.2008.03.015 |
| 14. | Krawczyk, S.; Gdaniec, M. Acta Crystallogr., Sect. E: Struct. Rep. Online 2005, 61, o2967–o2969. doi:10.1107/s1600536805025523 |
| 12. | Grillo, F.; Batchelor, D.; Larrea, C. R.; Francis, S. M.; Lacovig, P.; Richardson, N. V. Nanoscale 2019, 11, 13017–13031. doi:10.1039/c9nr04152d |
| 12. | Grillo, F.; Batchelor, D.; Larrea, C. R.; Francis, S. M.; Lacovig, P.; Richardson, N. V. Nanoscale 2019, 11, 13017–13031. doi:10.1039/c9nr04152d |
| 13. | Grillo, F.; Garrido Torres, J. A.; Treanor, M.-J.; Larrea, C. R.; Götze, J. P.; Lacovig, P.; Früchtl, H. A.; Schaub, R.; Richardson, N. V. Nanoscale 2016, 8, 9167–9177. doi:10.1039/c6nr00821f |
| 13. | Grillo, F.; Garrido Torres, J. A.; Treanor, M.-J.; Larrea, C. R.; Götze, J. P.; Lacovig, P.; Früchtl, H. A.; Schaub, R.; Richardson, N. V. Nanoscale 2016, 8, 9167–9177. doi:10.1039/c6nr00821f |
| 30. | Batchelor, D. R.; Schmidt, T.; Follath, R.; Jung, C.; Fink, R.; Knupfer, M.; Schöll, A.; Noll, T.; Siewert, F.; Büchner, B.; Umbach, E. Nucl. Instrum. Methods Phys. Res., Sect. A 2007, 575, 470–475. doi:10.1016/j.nima.2007.02.108 |
| 24. | Holland, D. M. P.; McGhee, H. G.; Lamanec, M.; Nachtigallová, D.; Milosavljević, A.; Bozek, J. D.; Muchová, E.; Ingle, R. A. Chem. Sci. 2026, 17, 7773–7786. doi:10.1039/d5sc09051b |
| 16. | Novak, I.; Abu-Izneid, T.; Kovač, B.; Klasinc, L. J. Phys. Chem. A 2009, 113, 9751–9756. doi:10.1021/jp905640b |
| 22. | Dupuy, R.; Penent, F.; Lutet-Toti, B.; Duval, V.; Palaudoux, J.; Céolin, D. Phys. Rev. A 2025, 112, 022824. doi:10.1103/w8nr-cmw1 |
| 23. | Velasquez, N.; Travnikova, O.; Guillemin, R.; Ismail, I.; Journel, L.; Martins, J. B.; Koulentianos, D.; Céolin, D.; Fillaud, L.; Rocco, M. L. M.; Püttner, R.; Piancastelli, M. N.; Simon, M.; Sheinerman, S.; Gerchikov, L.; Marchenko, T. Phys. Rev. Res. 2023, 5, 013048. doi:10.1103/physrevresearch.5.013048 |
| 15. | Roth, W.; Spangenberg, D.; Janzen, C.; Westphal, A.; Schmitt, M. Chem. Phys. 1999, 248, 17–25. doi:10.1016/s0301-0104(99)00262-1 |
| 12. | Grillo, F.; Batchelor, D.; Larrea, C. R.; Francis, S. M.; Lacovig, P.; Richardson, N. V. Nanoscale 2019, 11, 13017–13031. doi:10.1039/c9nr04152d |
| 15. | Roth, W.; Spangenberg, D.; Janzen, C.; Westphal, A.; Schmitt, M. Chem. Phys. 1999, 248, 17–25. doi:10.1016/s0301-0104(99)00262-1 |
| 15. | Roth, W.; Spangenberg, D.; Janzen, C.; Westphal, A.; Schmitt, M. Chem. Phys. 1999, 248, 17–25. doi:10.1016/s0301-0104(99)00262-1 |
| 25. | Batchelor, D. R.; Aygül, U.; Dettinger, U.; Ivanovic, M.; Tournebize, A.; Mangold, S.; Forster, M.; Scherf, U.; Peisert, H.; Chassé, T. Eur. Polym. J. 2016, 81, 686–693. doi:10.1016/j.eurpolymj.2016.04.005 |
| 15. | Roth, W.; Spangenberg, D.; Janzen, C.; Westphal, A.; Schmitt, M. Chem. Phys. 1999, 248, 17–25. doi:10.1016/s0301-0104(99)00262-1 |
| 15. | Roth, W.; Spangenberg, D.; Janzen, C.; Westphal, A.; Schmitt, M. Chem. Phys. 1999, 248, 17–25. doi:10.1016/s0301-0104(99)00262-1 |
| 16. | Novak, I.; Abu-Izneid, T.; Kovač, B.; Klasinc, L. J. Phys. Chem. A 2009, 113, 9751–9756. doi:10.1021/jp905640b |
© 2026 Bölke et al.; licensee Beilstein-Institut.
This is an open access article licensed under the terms of the Beilstein-Institut Open Access License Agreement (https://www.beilstein-journals.org/bjnano/terms), which is identical to the Creative Commons Attribution 4.0 International License (https://creativecommons.org/licenses/by/4.0). The reuse of material under this license requires that the author(s), source and license are credited. Third-party material in this article could be subject to other licenses (typically indicated in the credit line), and in this case, users are required to obtain permission from the license holder to reuse the material.