

Search results
Search for "database" in Full Text gives 127 result(s) in Beilstein Journal of Nanotechnology.
Nano-structuring, surface and bulk modification with a focused helium ion beam
Beilstein J. Nanotechnol. 2012, 3, 579–585, doi:10.3762/bjnano.3.67

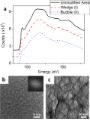
- in the spectra at ≈99 eV was observed to degrade from the top spectrum to the bottom. We compared our data to the spectra for crystalline and amorphous silicon from an online database [27]. The intensity of the peak at ≈99 eV is used as an indication of the crystallinity of the silicon. A higher


Towards a scalable and accurate quantum approach for describing vibrations of molecule–metal interfaces
Beilstein J. Nanotechnol. 2011, 2, 427–447, doi:10.3762/bjnano.2.48


Other Beilstein-Institut Open Science Activities